How anomaly detection works on Yorker's synthetic checks
A check that passes in 420ms and a check that passes in 2.1 seconds look the same to an assertion, as long as both are under the limit you set. One of them might be a real regression. The assertion can't tell, because it doesn't know what normal looks like for that check, from that location, at that time of day.
Anomaly detection in Yorker exists to answer that question. It learns what normal is for each check, scores every successful run against it, and only raises an alert when a deviation holds across several runs. This post explains how each of those steps works and why we built it that way.
Normal depends on where and when
A single average per check is the wrong baseline for synthetic monitoring. Latency from Singapore isn't latency from London, and a Tuesday morning under peak load isn't a quiet Sunday night. Averaging those together produces a number that is wrong for almost every individual run.
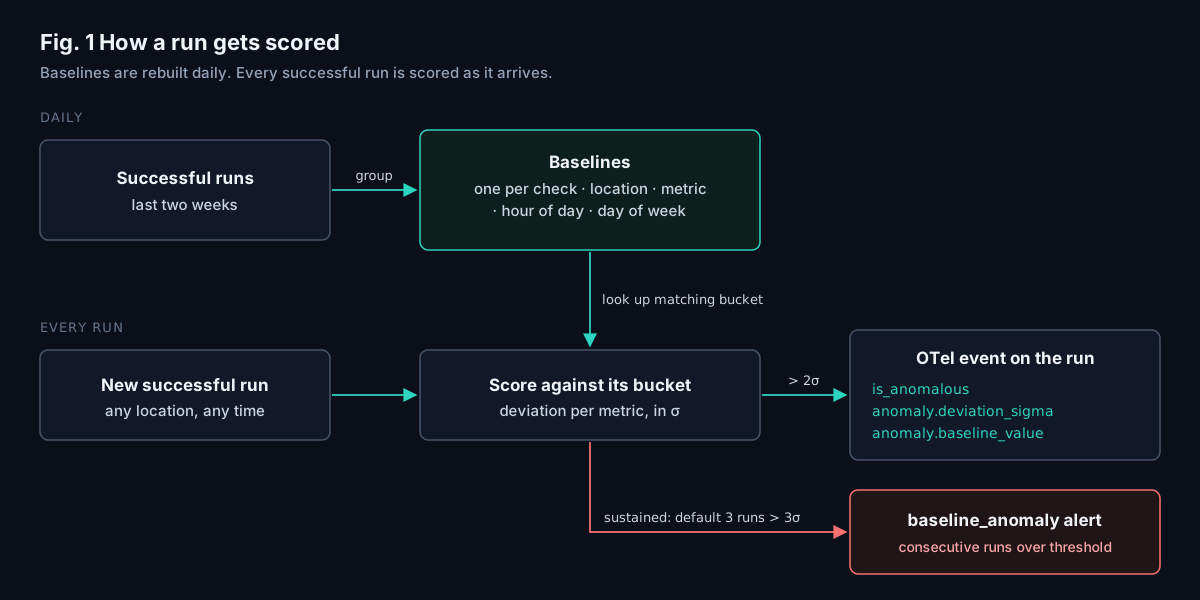
So Yorker keeps a separate baseline for every combination of check, location, metric, hour of day and day of week, built from the last two weeks of successful runs and refreshed daily. A run from Singapore at 03:00 UTC on a Tuesday is compared with Singapore's own Tuesday 03:00 history. Metrics are scored independently: response time, the DNS, TLS and first-byte phases, and for browser checks LCP, FCP and CLS.
Only successful runs feed the baseline. A failed run doesn't have a meaningful latency to learn from, and failures already have their own, more direct alerts.
New checks earn their baseline
A baseline needs history before it means anything, so a new check isn't scored until it has enough successful runs to learn from. Depending on how often it runs, that takes a few hours to a few days. Until then nothing is flagged. A baseline built from a handful of samples would mostly produce false alarms.
The same rule applies to time slots a check never runs in. A check scheduled only during business hours builds baselines for business hours and isn't scored outside them.
Every run gets a score
When a successful run comes in, Yorker looks up the baseline for that check, location, hour and day, and measures how far each metric sits from its mean in standard deviations. If any metric is more than two standard deviations out, the run is marked anomalous, and the largest deviation is recorded with the baseline it was measured against.
That score goes on the run's OTel event, next to everything else about the run:
| Attribute | Meaning |
|---|---|
synthetics.is_anomalous | true if any metric was more than 2σ from its baseline |
synthetics.anomaly.deviation_sigma | size of the largest deviation, in standard deviations |
synthetics.anomaly.baseline_value | the baseline mean it was measured against |
Because it's on the event, it's queryable in your own backend and usable by anything that reads your telemetry, including AI SRE tools and deploy gates.
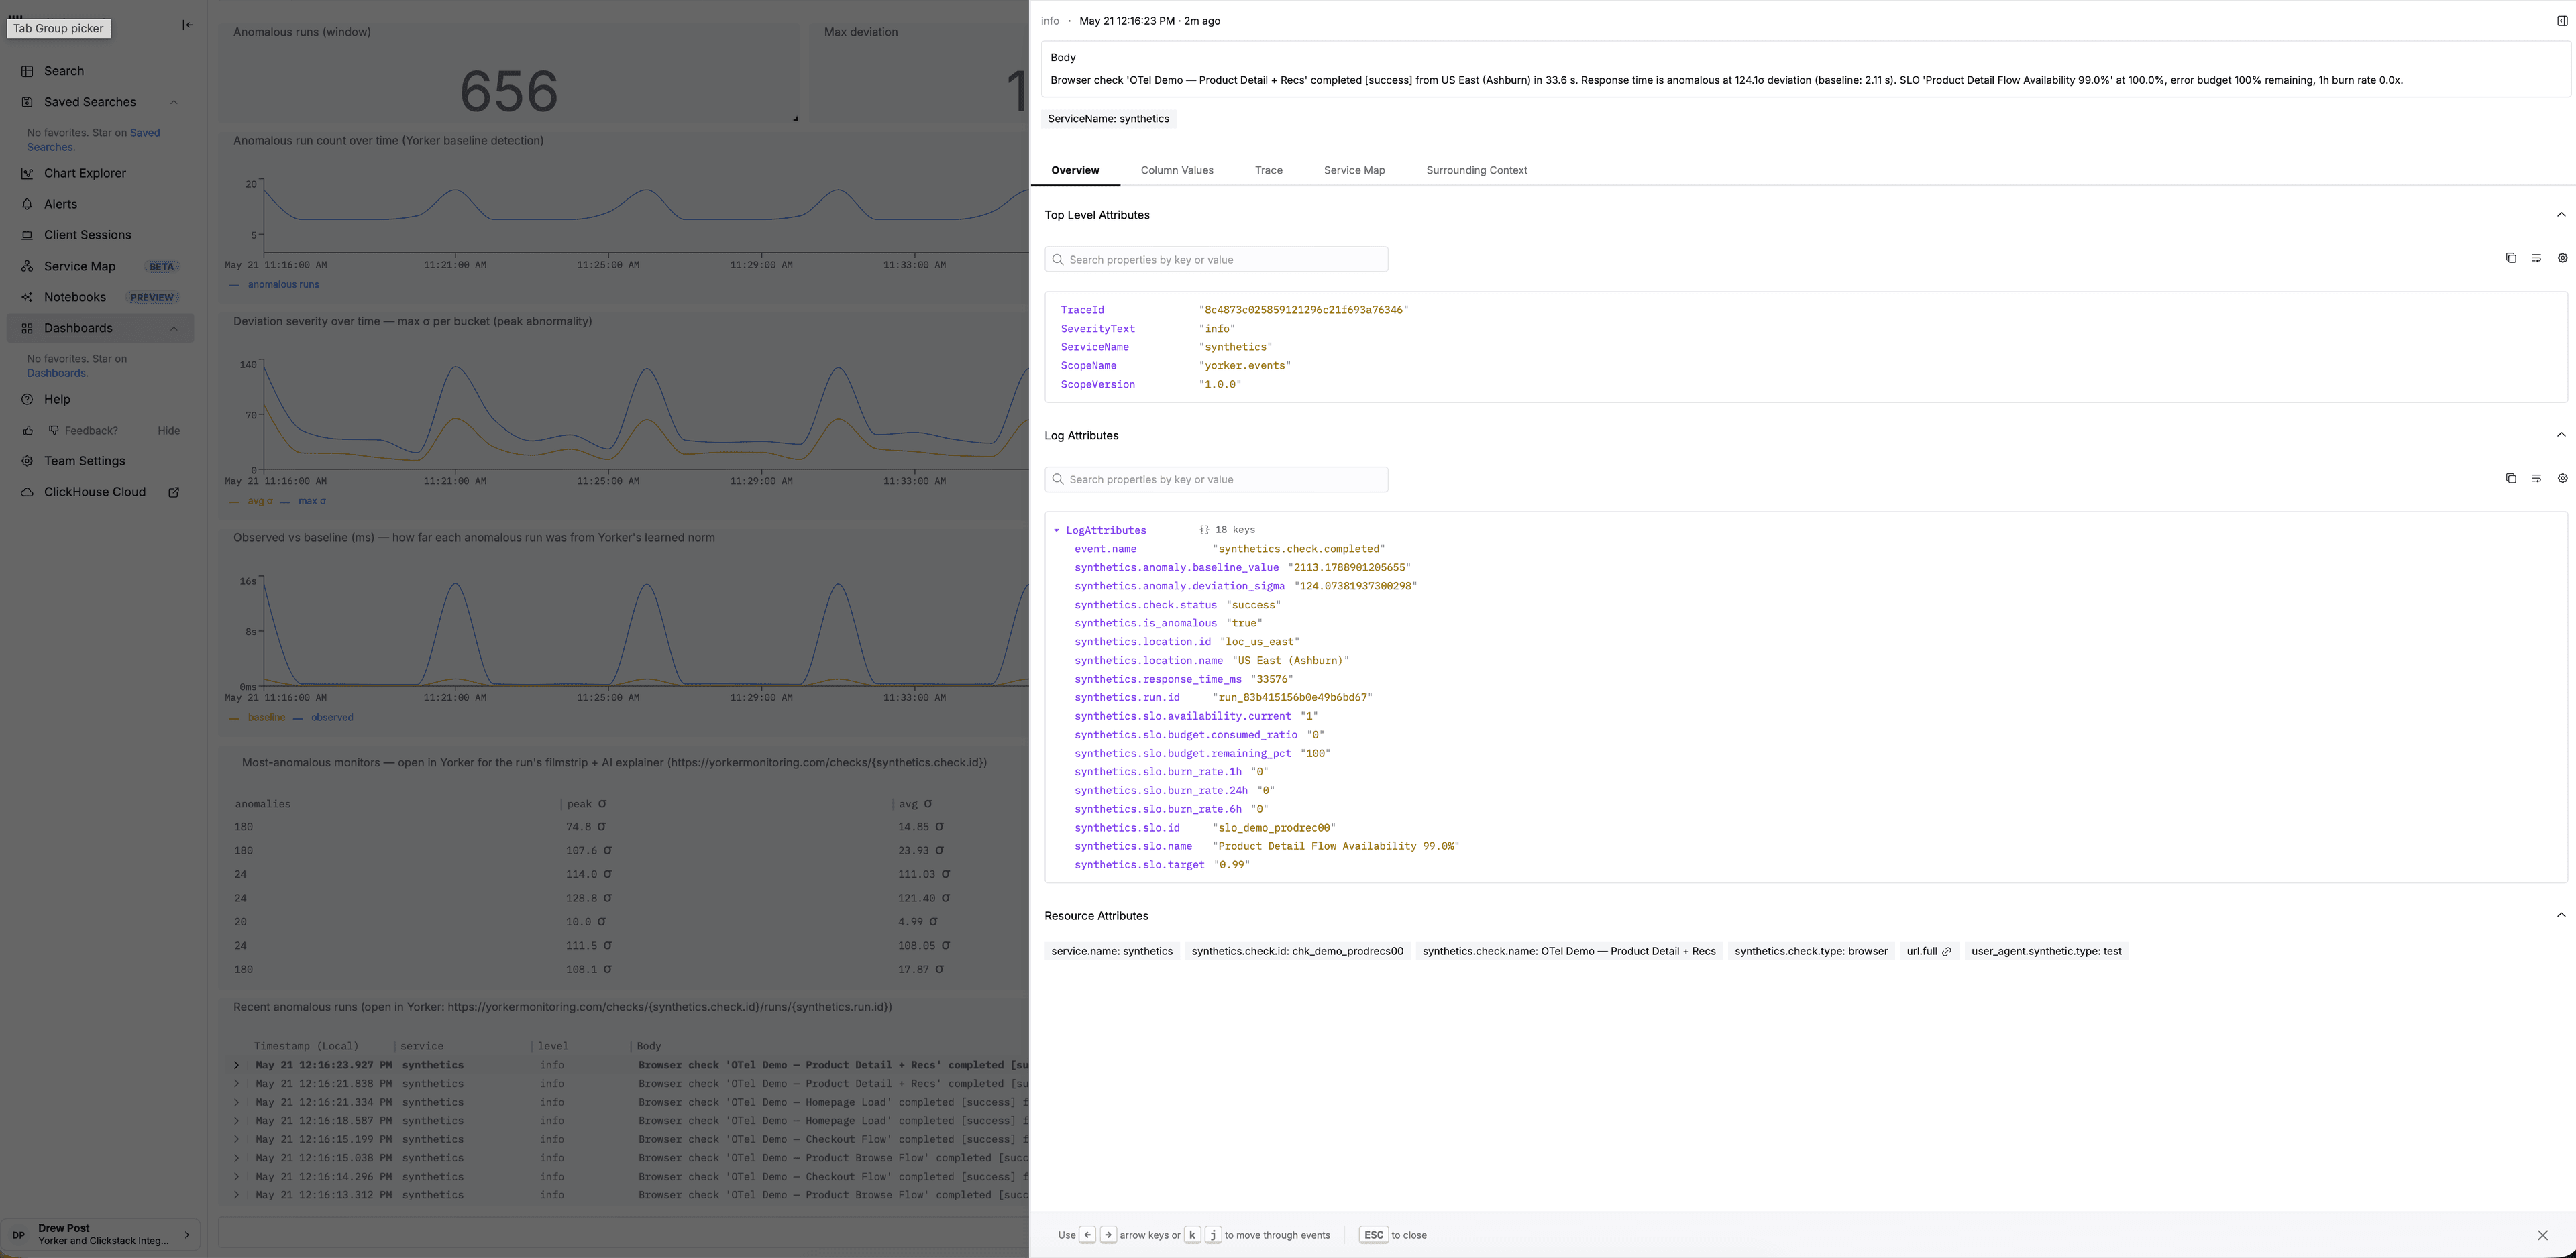
This is the slow-but-passing case. The run above passed every assertion and reported success, but took 33.6 seconds against a baseline of about 2.1. A fixed threshold set anywhere above 33.6 seconds would have stayed green.
A flag on one run isn't an alert
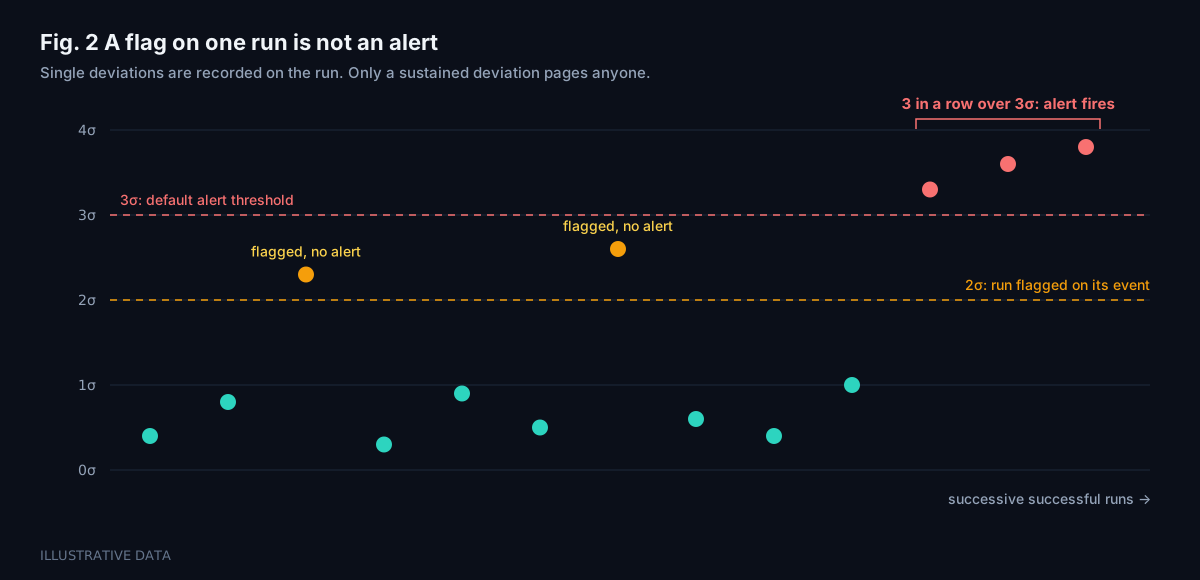
Roughly one run in twenty will land outside two standard deviations by chance alone. Paging on every one of those would produce exactly the flappy monitor this feature is meant to replace.
So the per-run flag is information, and alerting is a separate decision. The baseline_anomaly alert condition fires only when several consecutive successful runs deviate beyond a stricter threshold. By default that's three runs in a row, each more than three standard deviations above baseline, and all three settings are configurable per alert. A failed run breaks the sequence, because an outage is a different signal with its own alerts.
The resulting alert says in plain language what it checked:
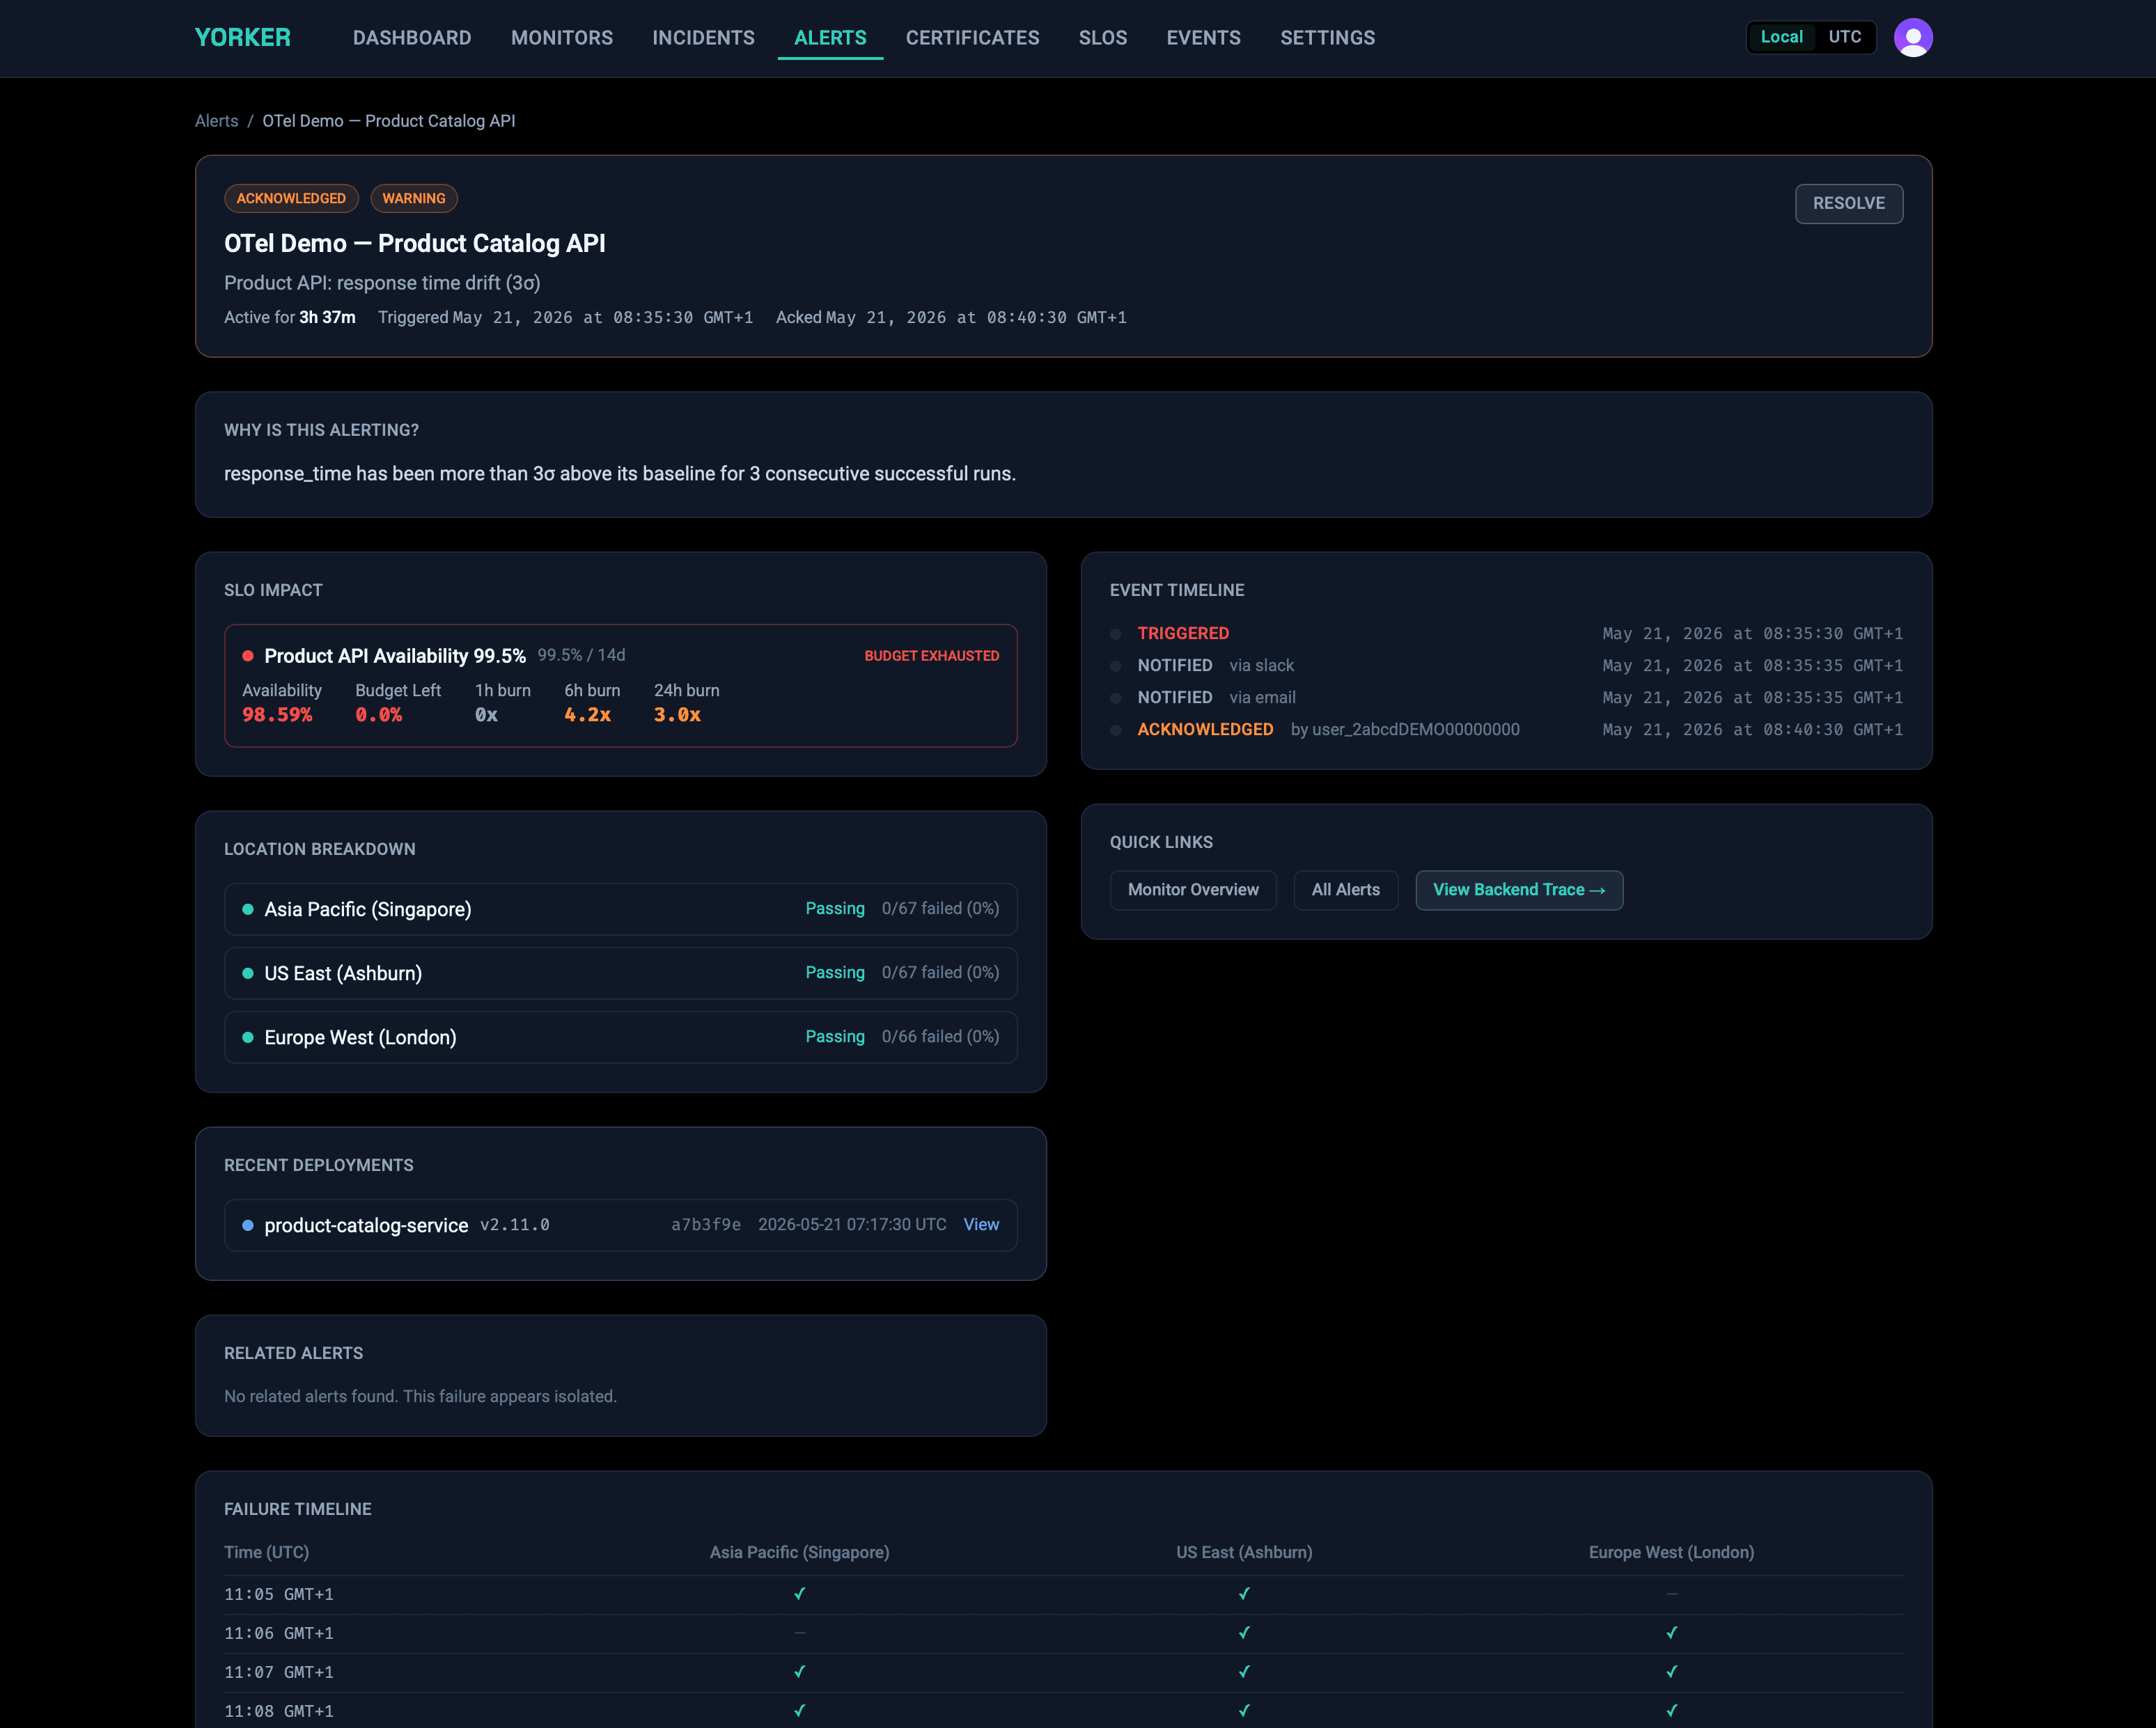
Every location in that breakdown is passing, and nothing is down. That's the kind of problem this alert exists for, and the one a failure-based alert can't see.
What it's designed to catch
Baselines follow the last two weeks, so they measure change against recent behaviour. A regression is flagged when it appears and while it holds. If a slower latency becomes permanent, it gradually becomes the new normal, and the anomaly signal settles. That's intended: anomaly detection answers "is this different from usual", and an absolute limit answers "is this acceptable". If you have a hard latency commitment, pair a baseline alert with a threshold alert or an SLO.
Scoring is per check, too. When several checks degrade together because they share a dependency, the triage view groups their alerts, so one upstream problem reads as one problem.
See the alert conditions reference, including baseline_anomaly