The ClickStack Monitoring Gap: Adding Synthetic Checks to Your ClickHouse Observability Stack
If you're running ClickStack you've already made a good call. ClickHouse for storage, HyperDX for the UI, OpenTelemetry feeding it. It's fast, it's open, and you're not paying $15 a host for the privilege of your own data.
But there's a hole in it, and it's the same one I keep seeing: nothing is checking whether your app actually works from the outside. You've got metrics on how your services behave internally, traces across your microservices, logs of what happened. What you don't have is a synthetic user sitting in a handful of regions hitting your app the way a real one would, every minute.
Green internally, broken for users
Internal telemetry tells you how your system is behaving. It can't tell you what a user in Frankfurt is actually experiencing. Those aren't the same thing and the gap between them is where the embarrassing outages live.
Your ClickHouse dashboards can be green across the board, healthy CPU, low latency, no errors, while the CDN in front of you rotated a cert that doesn't chain properly in Safari. Or your DNS provider is having a regional wobble. Or a third-party script on checkout started throwing 403s. None of that shows up internally. All of it shows up the second a synthetic check actually loads the page.
Synthetic checks that don't talk to anything else
There's one move the big all-in-one suites are good at: a check fails, you click into the trace it generated, then down into the infra under it, without leaving the tool. Failure to root cause in three clicks. It works because the synthetic data and the traces sit in the same place.
On a ClickStack setup they usually don't. Your traces and metrics are in ClickHouse, but synthetic checks tend to live in some standalone uptime tool that's never heard of your HyperDX. So an incident is a red dot over here, a hunt through HyperDX for the trace that roughly lines up by timestamp over there, and a separate poke at the infra. The correlation that should be one click is something you do in your head at 2am.
You don't fix that by running a suite. You fix it by making the synthetic check part of the same stack as everything else, so it lands in ClickHouse and stitches into the same traces.
So make it speak OTel
The worst version of fixing this is adding another silo. Another vendor, another dashboard, another data format, another alert pipeline, and now you're tabbing between three UIs to understand one incident. That's the opposite of why you run a single open stack in the first place.
If your whole stack speaks OpenTelemetry, and on ClickStack it does, your synthetic checks should speak it too. That was the starting point for Yorker. Every check, HTTP or browser, comes out as standard OTLP and lands in your ClickHouse next to your application telemetry:
- Metrics:
synthetics.http.response_time,synthetics.check.success,synthetics.browser.lcp,synthetics.dns.lookup_duration,synthetics.tls.handshake_duration - Resource attributes:
synthetics.check.id,synthetics.location.id,synthetics.run.id,url.full,service.name - Trace correlation: W3C
traceparentheader propagation
Same query engine, same dashboards, same alert rules, no context-switching.
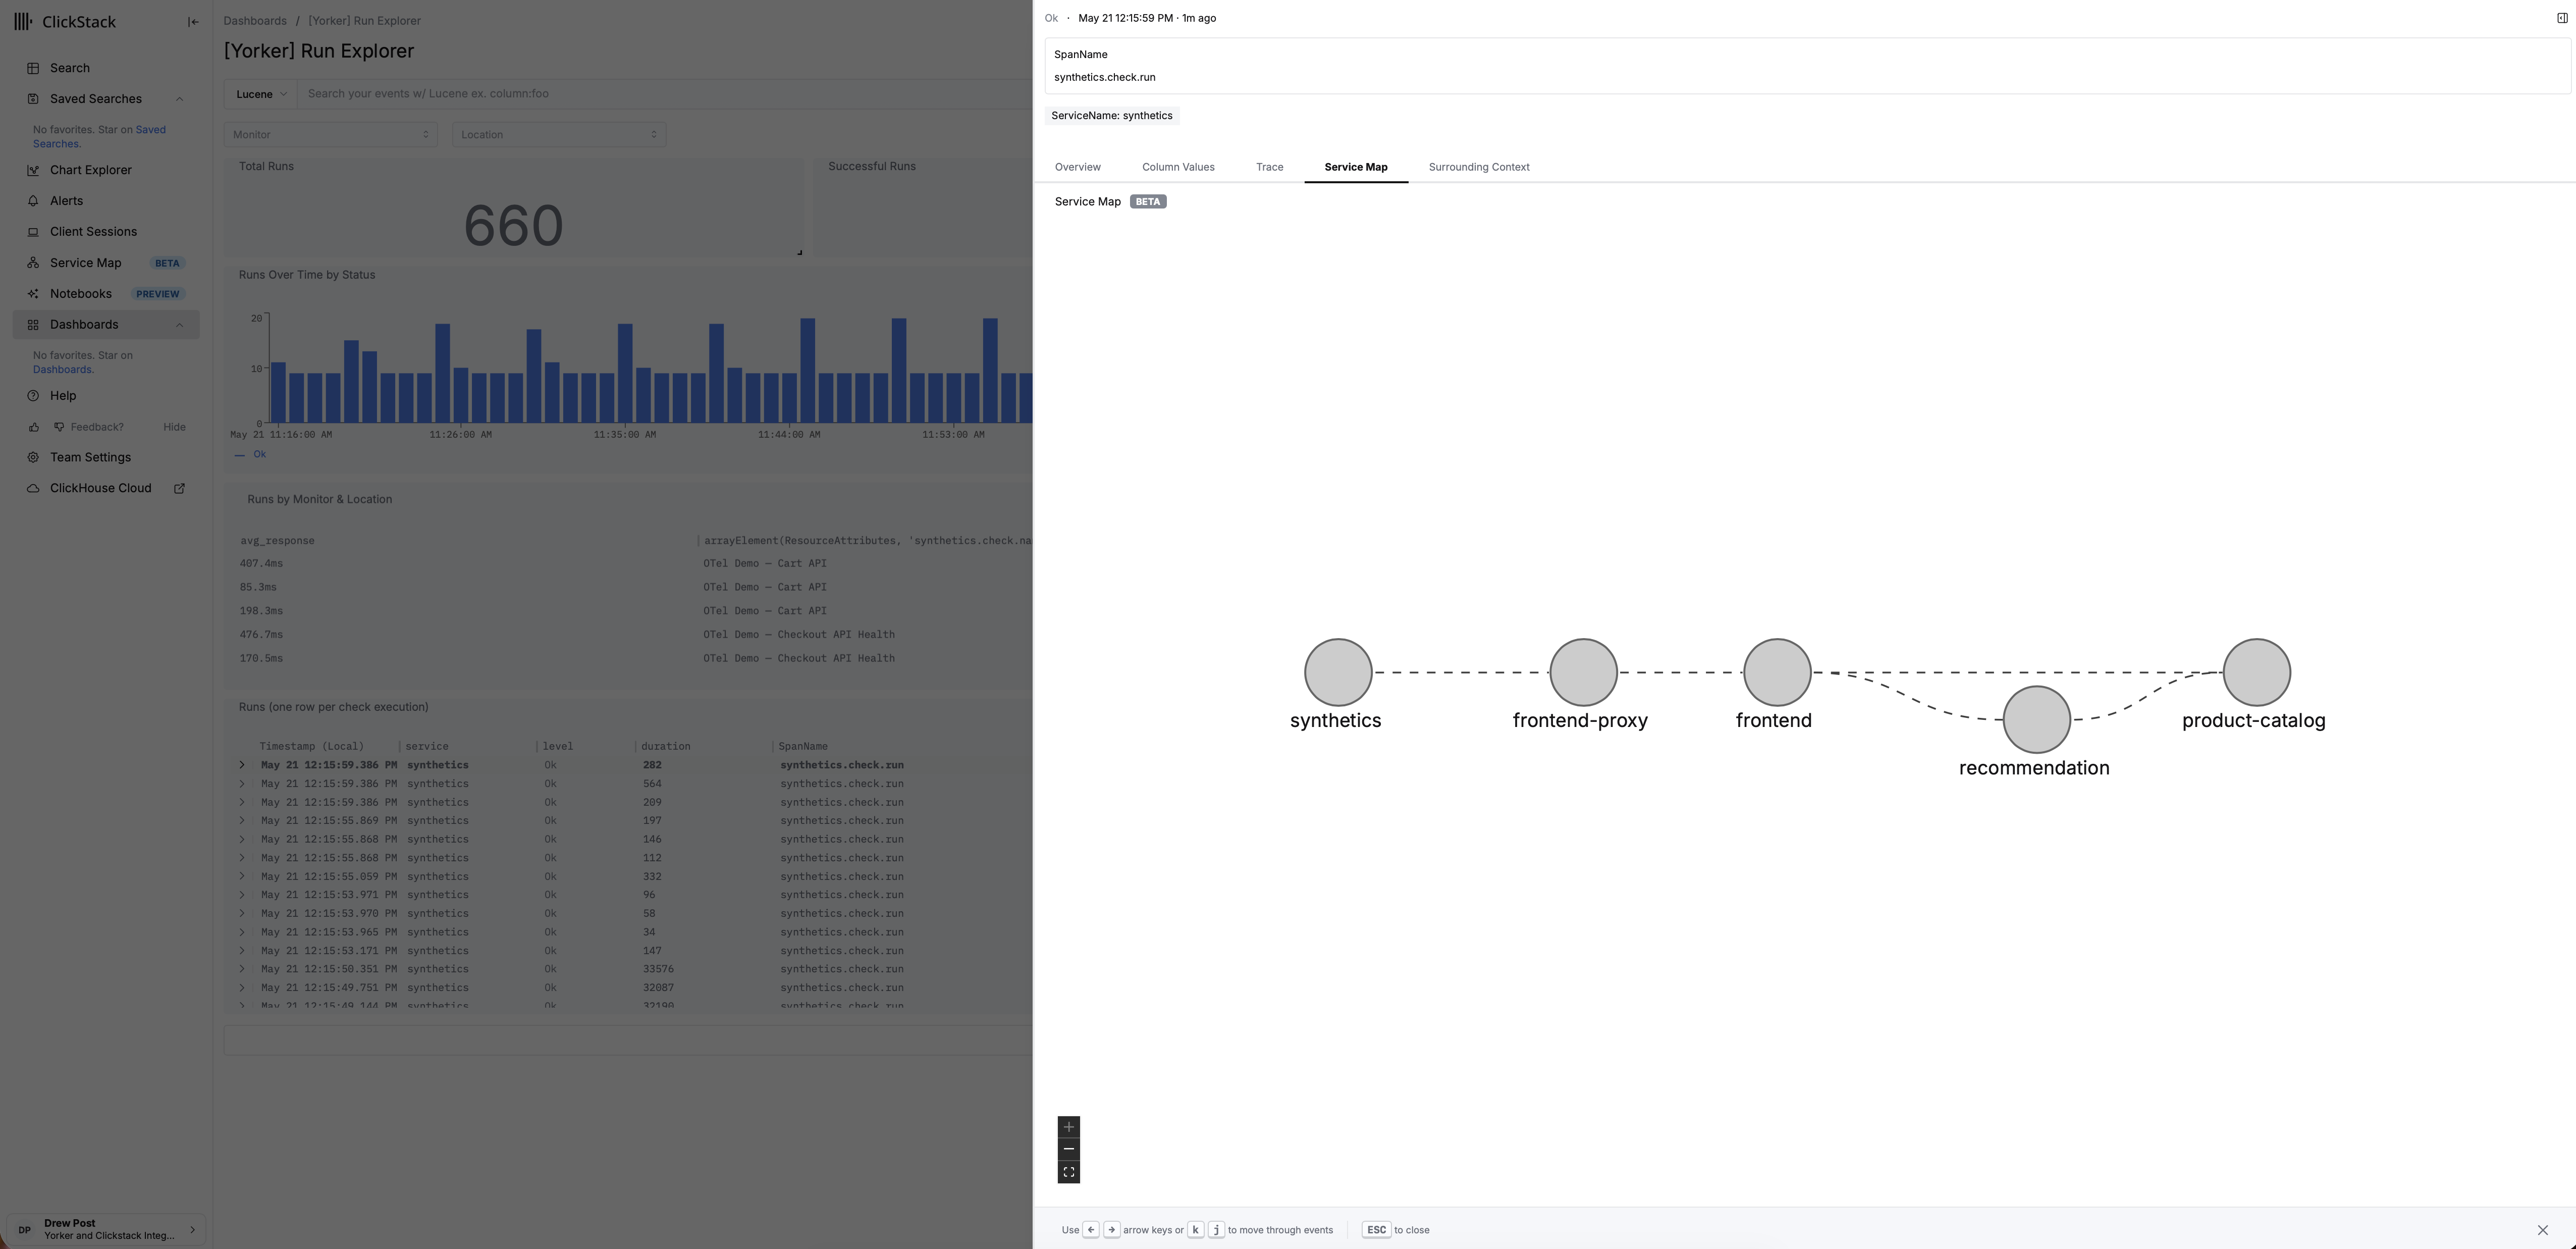
Getting the data there is the easy half though. What it looks like when it arrives is what actually matters. Most tools that bolt on an OTLP exporter just hand your backend a status code and a response time and call it a day. That's a data point, not context. Yorker runs the analysis before the signal leaves, so what lands in ClickHouse is closer to a verdict than a raw number:
synthetics.is_anomalous,synthetics.anomaly.deviation_sigmaandsynthetics.anomaly.baseline_valuewhen a run drifts from its per-metric, per-location baseline. A scored deviation, so the silent slowdowns that never trip a hard failure still arrive flagged.synthetics.third_party.domains,synthetics.third_party.countandsynthetics.third_party.total_byteson browser checks, so when someone else's CDN or tag is the cause, the blast radius is already in the data.synthetics.consecutive_failuresandsynthetics.suggested_next_stepson failures, so a flap reads differently from a sustained outage.
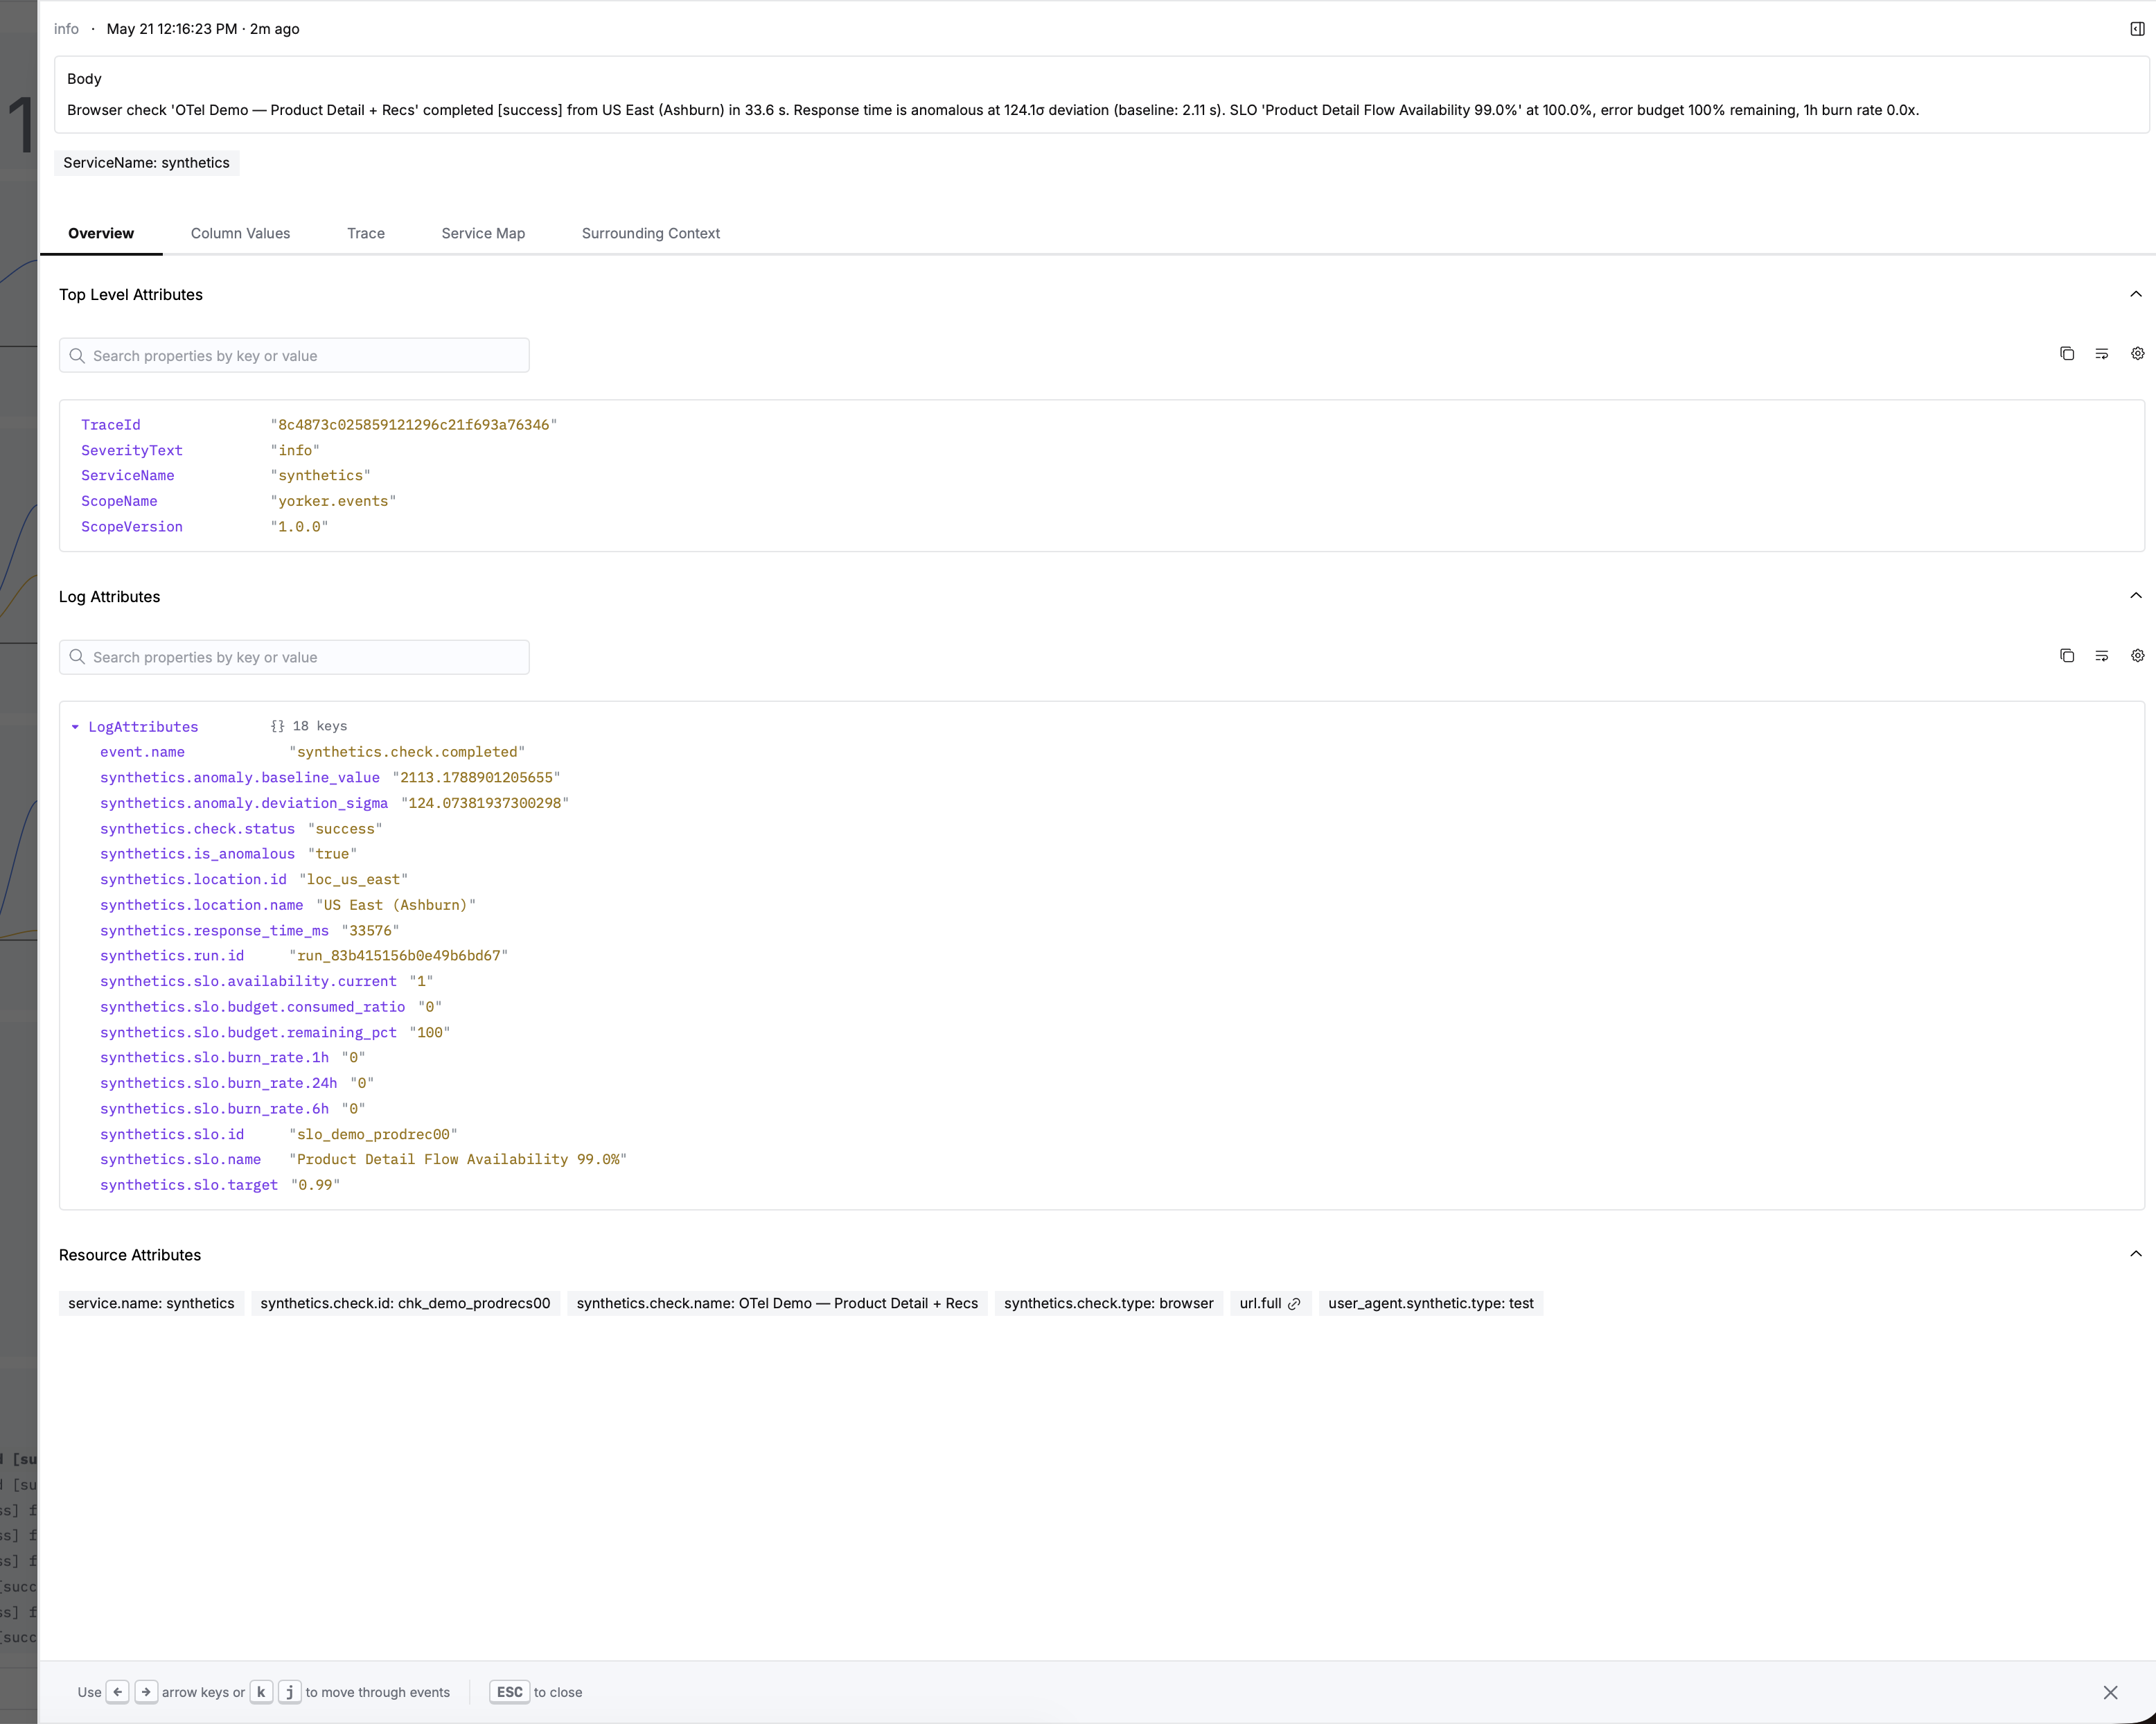
This also happens to be what the agentic RCA tools everyone's bolting on now actually need. Point a causal engine at your ClickHouse and it's only as good as what you feed it. A green dot tells it nothing. An anomaly-scored, third-party-attributed, trace-joined event tells it where to look.
Synthetic check and backend trace, same trace
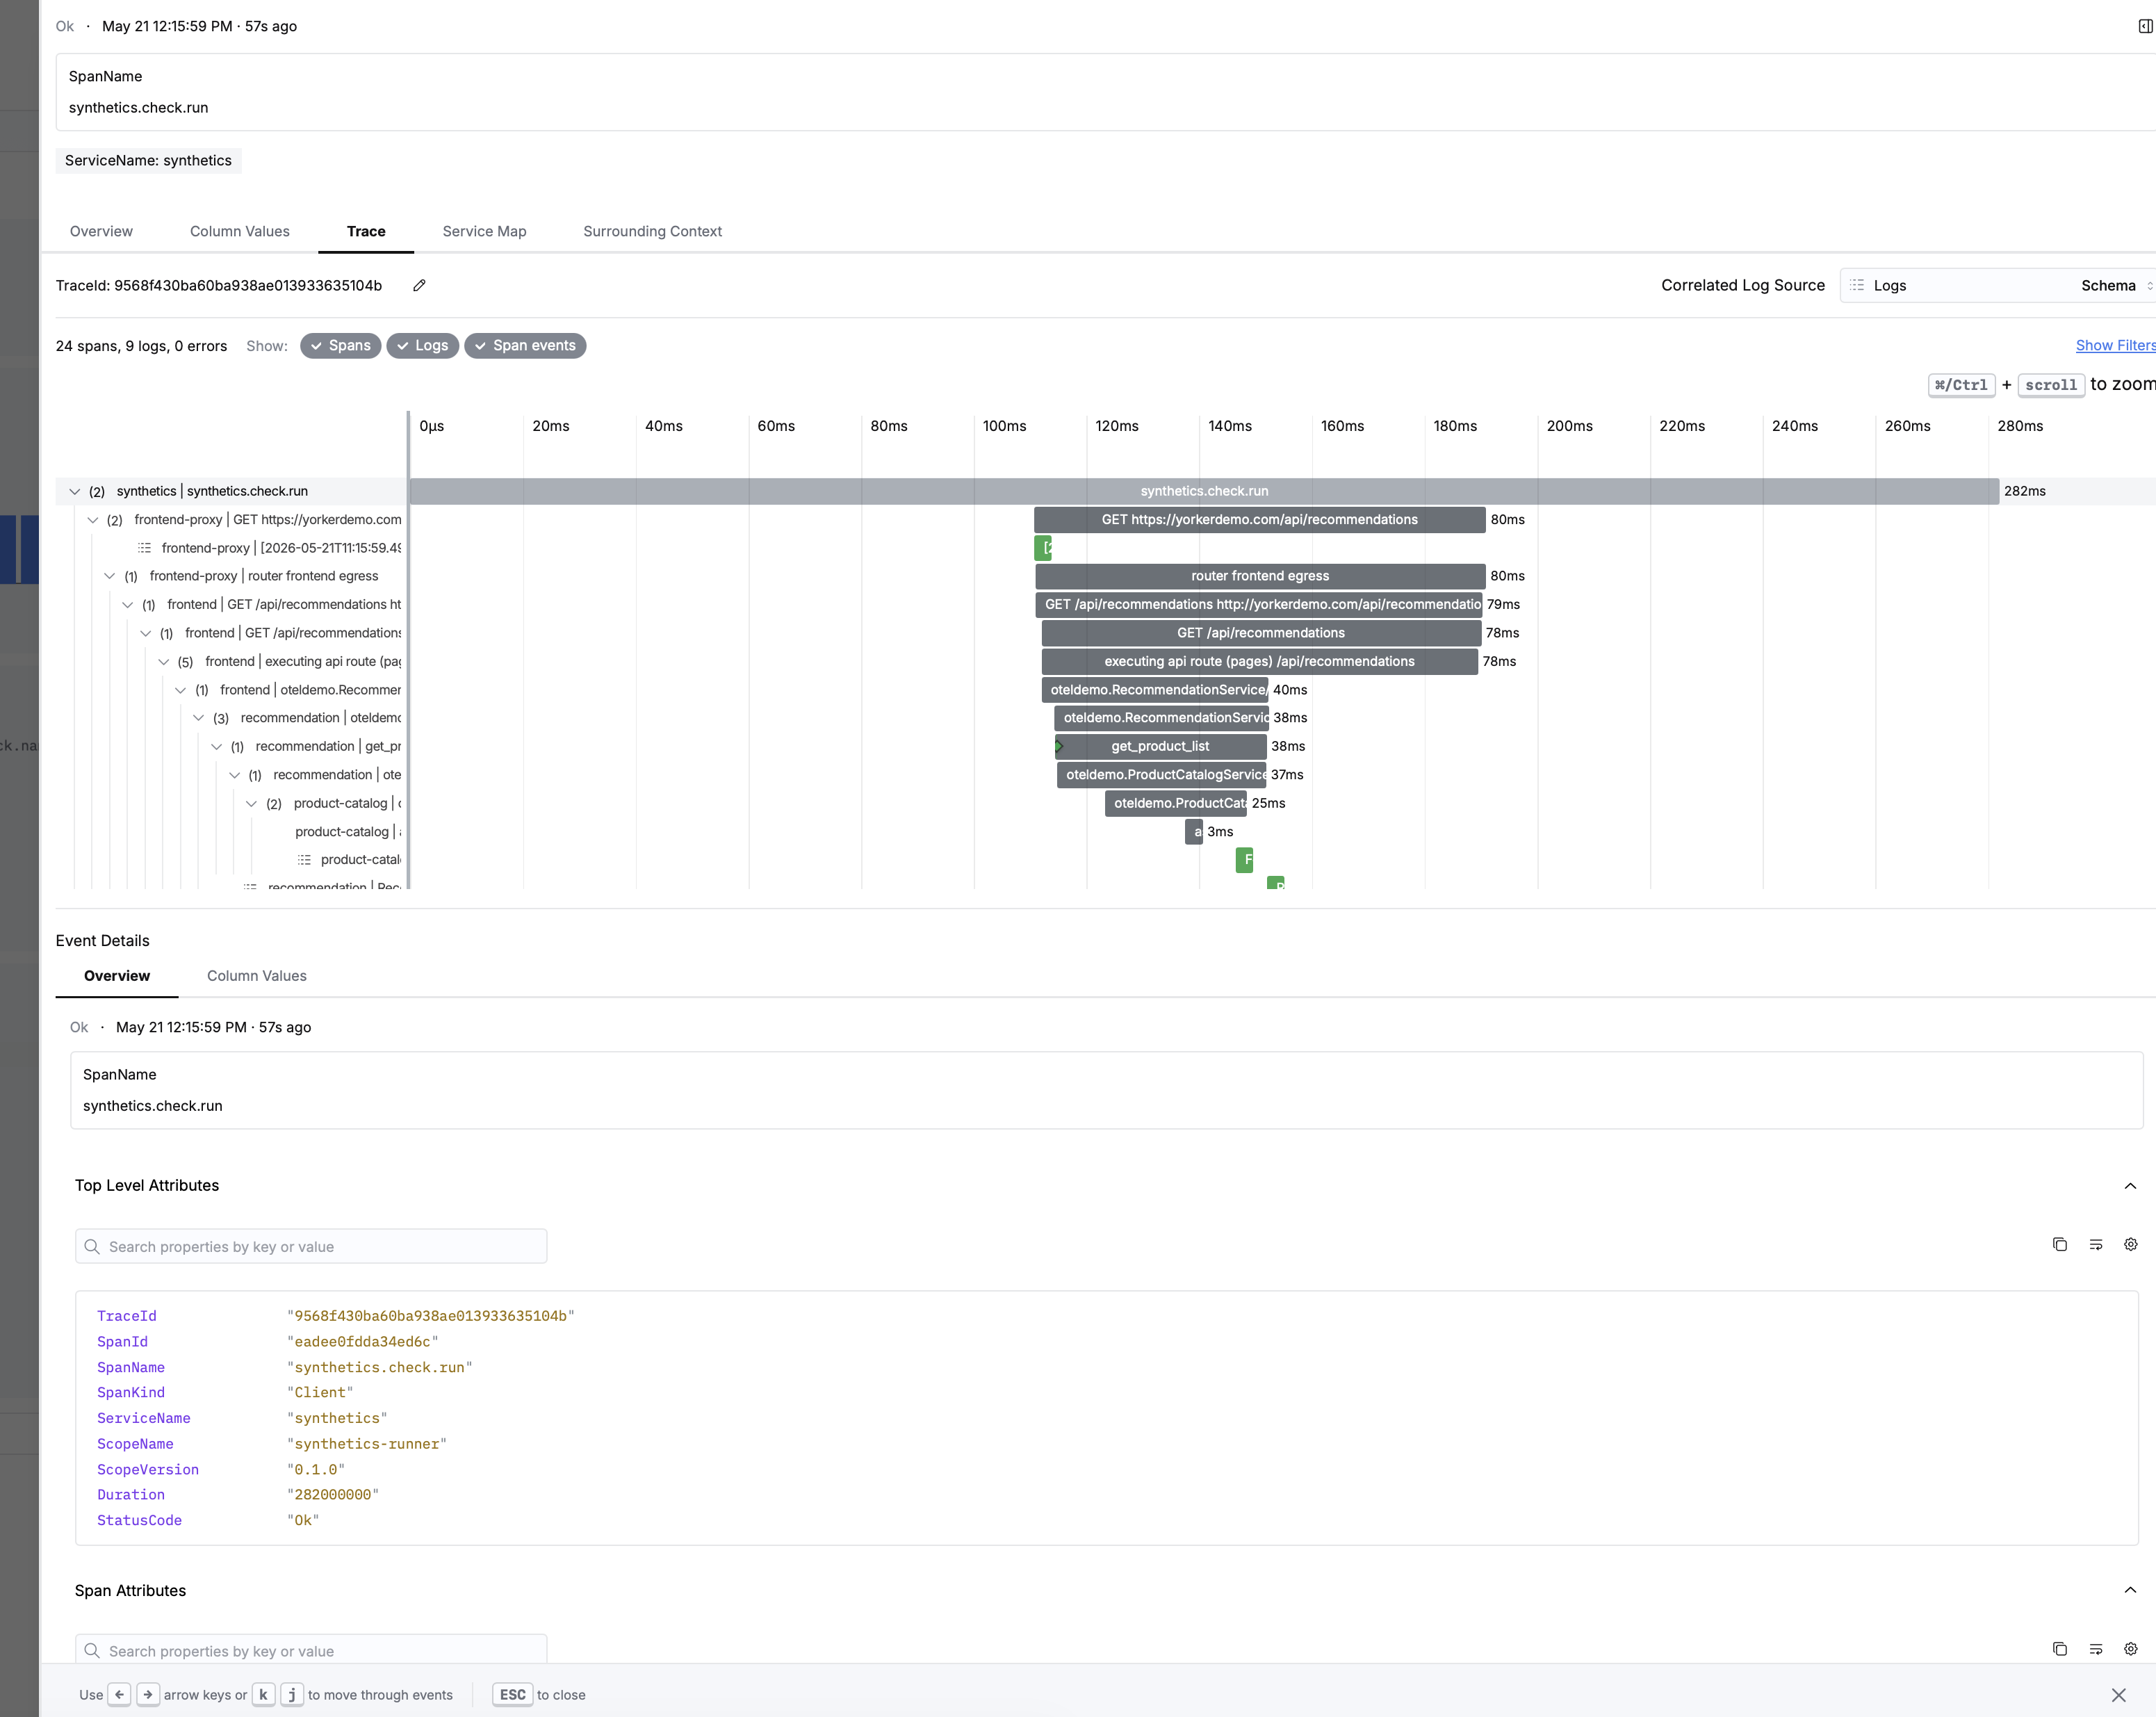
This is the part I care most about. When Yorker runs a browser check against your checkout flow it injects a W3C traceparent into the requests. Your app, already instrumented with OTel, picks that context up and carries on the distributed trace.
So a failure doesn't just say "checkout's broken." It hangs off the actual trace that shows you why: the query that timed out, the service that 500'd, the middleware that bounced the request. Same trace, synthetic step at the top, backend spans underneath.
In your ClickStack:
- Yorker detects checkout failure from
loc_eu_central - Alert fires with screenshot filmstrip showing the error state
- Click through to the OTel trace in HyperDX
- See the exact backend span where the request failed
- Fix the issue, confirm the next synthetic check passes
No tab-switching. No correlating timestamps across tools. One trace, from synthetic check to root cause.
What the integration looks like
No special ClickHouse plugins, no custom exporters. You point Yorker at your OTLP endpoint (the same HyperDX or collector ingest your applications already send to), and Yorker forwards each enriched check result there as standard OTLP over HTTP.
So the signals show up in the same tables, queryable with the same SQL, visualizable in the same dashboards as everything else. No second pipeline to run.
The synthetic check metrics join naturally with your application metrics. You can build a single ClickHouse dashboard that shows:
- Application response times (from internal instrumentation)
- Synthetic response times (from external checks)
- The delta between them (network/CDN/DNS overhead your users experience)
- Global availability by region
- SLO burn rates combining both internal and external signals
A config that fits your stack
Here's how a Yorker config looks for a team already running ClickStack:
project: my-app

defaults:
  frequency: 1m
  locations:
    - loc_us_east
    - loc_eu_central
    - loc_ap_southeast

monitors:
  - name: API Health
    type: http
    url: https://api.example.com/health
    assertions:
      - type: status_code
        value: 200
      - type: response_time
        max: 500

  - name: Dashboard Login
    type: browser
    script: ./monitors/login.ts
    frequency: 5m

slos:
  - name: API Availability
    monitor: API Health
    target: 99.9%
window: 30dPlain YAML. Deploy with yorker deploy. The checks run from 14 global locations, each enriched result is forwarded to your OTLP endpoint as standard OTLP, and it lands in your ClickHouse alongside everything else. HyperDX surfaces it the same way it surfaces your application data.
No new vendor dashboard to learn. No proprietary data format to deal with. No additional data pipeline to maintain.
Dashboards you don't have to build
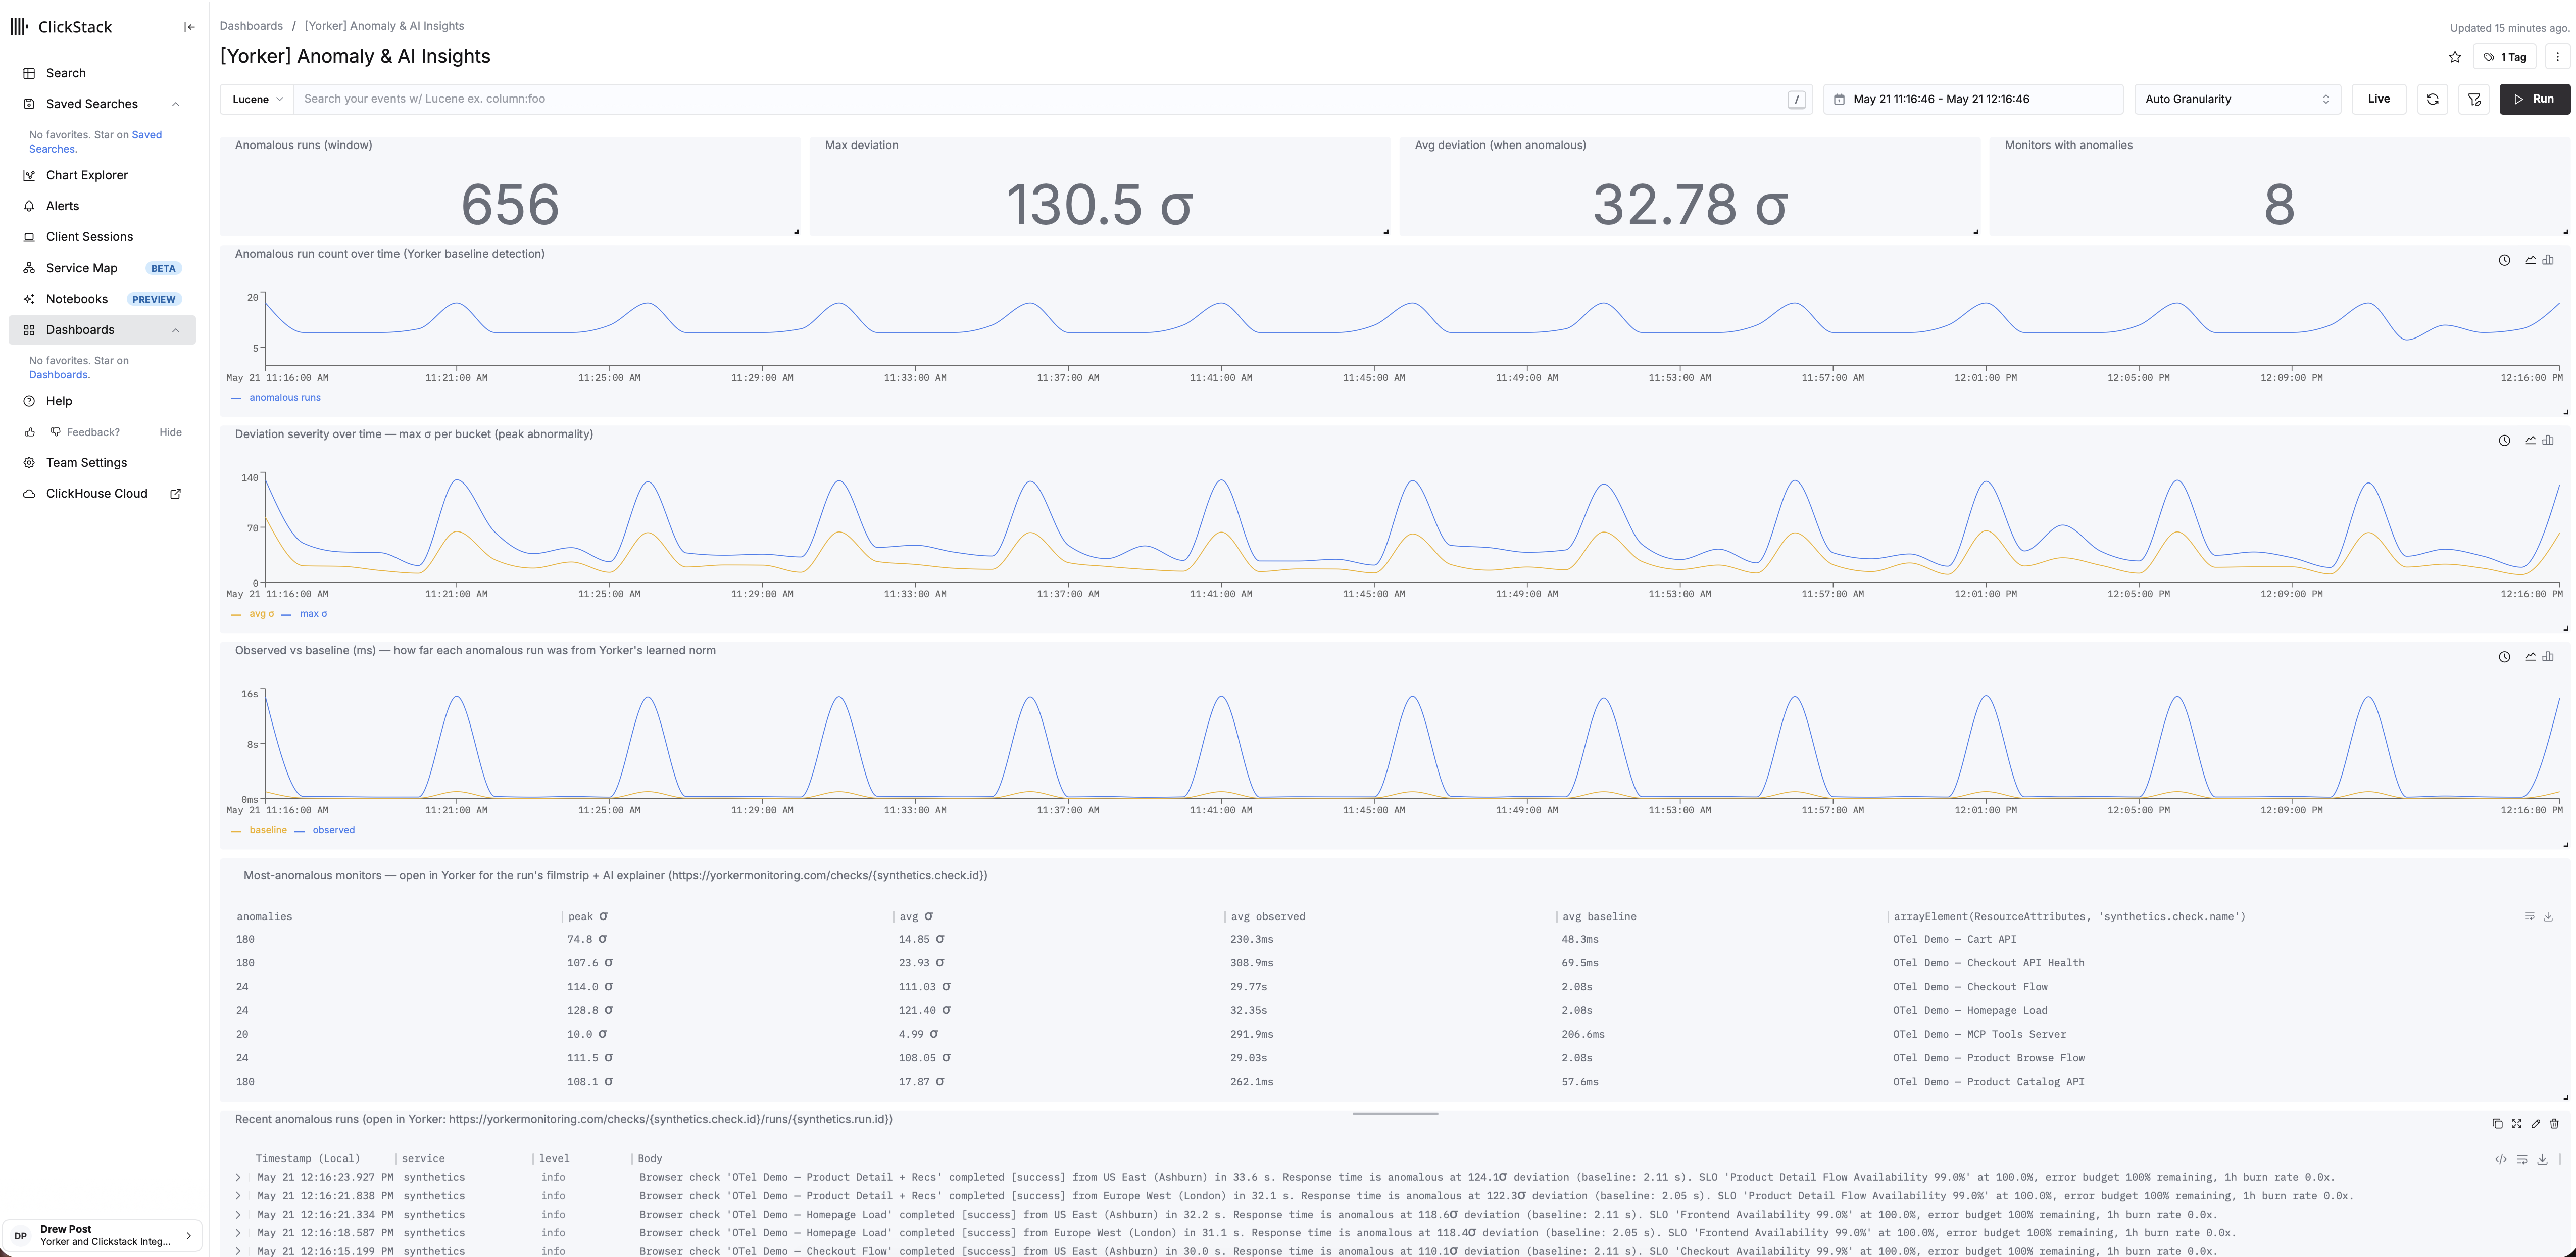
Emitting good telemetry has a catch nobody warns you about: now you have to build the dashboards to read it. I did that bit so you don't have to. Yorker ships eight pre-built HyperDX dashboard packs, one command to install:
yorker dashboards install
That drops a set of ready-to-use dashboards into your HyperDX (self-hosted or ClickStack Cloud): an overview, a deep-dive, SLO tracking, anomaly insights, performance forensics, third-party attribution, TLS health, and a run-event explorer. They query the same synthetics.* attributes described above, so they work the moment your checks start emitting. If you'd rather build your own, the attributes are all standard OTLP and documented; nothing is hidden behind a proprietary schema.
While we're talking about not paying the suite tax
Part of ClickStack's whole pitch is that it's cheaper and faster to run than the big all-in-one platforms, and for a lot of teams that's exactly why it's the stack of choice. But plenty of those same teams still pay a suite for synthetic checks on the side, which sneaks the bloat back in through a side door you thought you'd closed.
Synthetic pricing is where it bites, because the cost scales with the exact thing you want to do: check often, from lots of places. Datadog bills browser runs at roughly $18 per 1,000, on-demand, usually buried inside a bigger contract. Run a few browser journeys every minute from a handful of regions and that's not a rounding error, it's a real line item (Datadog's own synthetic spend often lands at 8 to 15% of the total contract). You end up rationing how thoroughly you watch your own app to manage a bill, which is exactly backwards.
I built the pricing to not do that. One flat plan at $29.99/mo, not a ladder of tiers where the feature you actually want is locked in the top one next to a sales call. HTTP and MCP checks are unlimited, from every region, no per-run charge. Browser runs come with 5,000 included, then it's simple volume-based consumption that gets cheaper the more you run, not more punishing. And private locations are half the per-run rate, because on a private location you're providing the compute, so it'd be cheeky to charge you full whack. The whole table is public, no "contact us".
None of that makes Yorker the cheapest possible number on a spreadsheet. The point is the model matches the instinct that put you on ClickStack in the first place: you shouldn't have to ration how well you watch your own app to keep the bill sane.
The stack, complete
| Layer | Tool | Signals |
|---|---|---|
| Application instrumentation | OpenTelemetry SDKs | Traces, metrics, logs |
| Synthetic monitoring | Yorker | External availability, response times, screenshot filmstrips |
| Collection | OTel Collector | Routes all signals |
| Storage | ClickHouse | Everything in one place |
| Visualization | HyperDX | Unified dashboards, trace correlation |
That's the whole thing, open the whole way down. Internal and external monitoring in the same format, the same storage, the same query engine, and nothing proprietary sitting between you and your own data.
Getting started
If you're already running ClickStack, adding synthetic monitoring takes about five minutes:
- Create a
yorker.config.yamlin your repo - Define your monitors in plain YAML
- Point Yorker at your OTLP endpoint (the HyperDX or collector ingest you already use)
yorker deploy, thenyorker dashboards install
Your synthetic checks start running. The telemetry flows to ClickHouse. HyperDX shows it alongside your application data. The gap is closed.