End-to-end tests and synthetic monitors are converging

Put your end-to-end test suite and your synthetic monitoring config side by side. If both were written in the last two years, there's a decent chance they use the same tool, the same script shape and roughly the same assertions: page.click, page.waitForSelector, a check on text or a status code. The checkout flow your QA suite exercises on every pull request is, structurally, the same checkout flow your uptime tool is supposed to be watching in production.
That wasn't true ten years ago. Functional testing and synthetic monitoring grew up as separate disciplines with their own tools and owners. The boundary held because four things reinforced it: different teams, different environments, different timing, and different consumers of the result. Each of those is weakening now, which raises a fair question: are "test" and "monitor" still two different things, or two moments in the same thing's life?
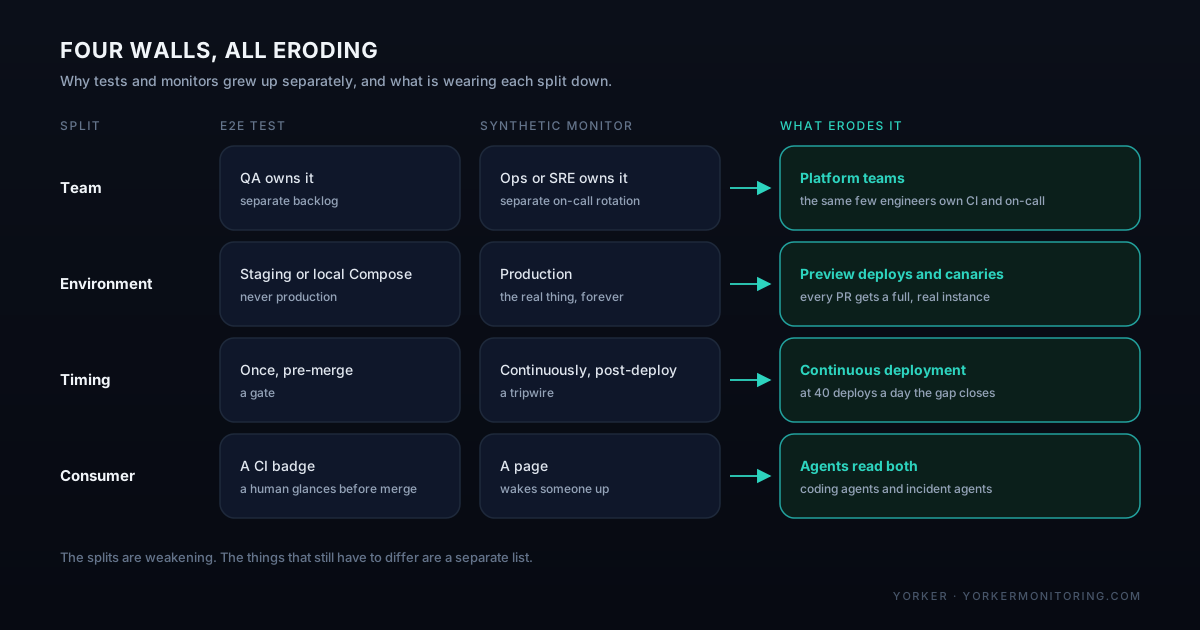
The four walls that used to hold
Team. QA owned tests, ops or SRE owned monitoring. Different backlog, different standup, often a different reporting line. Platform teams now own both, frequently as the same two or three engineers who set up the CI pipeline and the on-call rotation.
Environment. Tests ran against staging or a local Docker Compose stack. Monitors ran against production. That split made sense when staging and production were meaningfully different systems. It makes much less sense when every pull request gets a preview deploy that's a full, real instance of the app, and a canary rollout turns "production" into a moving target watched the same way you'd watch staging.
Timing. Tests ran once, pre-merge, as a gate. Monitors ran continuously, post-deploy, as a tripwire. Continuous deployment collapses the gap between those two moments. If you deploy forty times a day, "pre-merge" and "just happened in production" are close enough in time that the distinction stops doing much work.
Consumer. A test result was a CI badge a human glanced at before clicking merge. A monitor result was a page that woke someone up. Both are increasingly read by software first. A coding agent reads the CI result to decide whether to keep iterating or open the PR, the same way it increasingly writes the flow it's testing. An incident-response agent reads a monitor's failure signal to decide whether to page a human, attempt a rollback, or wait for the next run.
None of that makes testing and monitoring the same thing. The reasons they used to be obviously different are weakening one at a time, and neither discipline chose that.
What still has to differ, and why
"Converging" is a weaker claim than "the same." Six things don't converge, and pretending otherwise breaks something in production.
Side effects and test data. A CI test against an ephemeral environment can create an account, place an order, and delete a record with no consequence, because the whole environment gets torn down after the run. A monitor runs against the real thing, forever, on a schedule. Every run of a checkout monitor is a real transaction unless you've engineered it not to be: a reserved test SKU that doesn't touch real inventory, a payment method scoped to a sandbox key, a test account that's excluded from your analytics and billing reports, and a cleanup job that reaps whatever the probe account accumulates. None of that is optional. A monitor without a test-data plan either pollutes your production data or quietly stops asserting anything real.
Destructive paths. A "delete account" test earns its keep in CI precisely because it's destructive and you want to know if it stops working. Running the same step against production, on a schedule, forever, is a different risk calculation entirely. Most teams either point the destructive step at a dedicated, disposable monitoring tenant that gets recreated nightly, or they don't synthesise that path in production at all and lean on real-traffic error-rate alerting for it instead. Either is defensible. Silently running it unmodified against a real account is not.
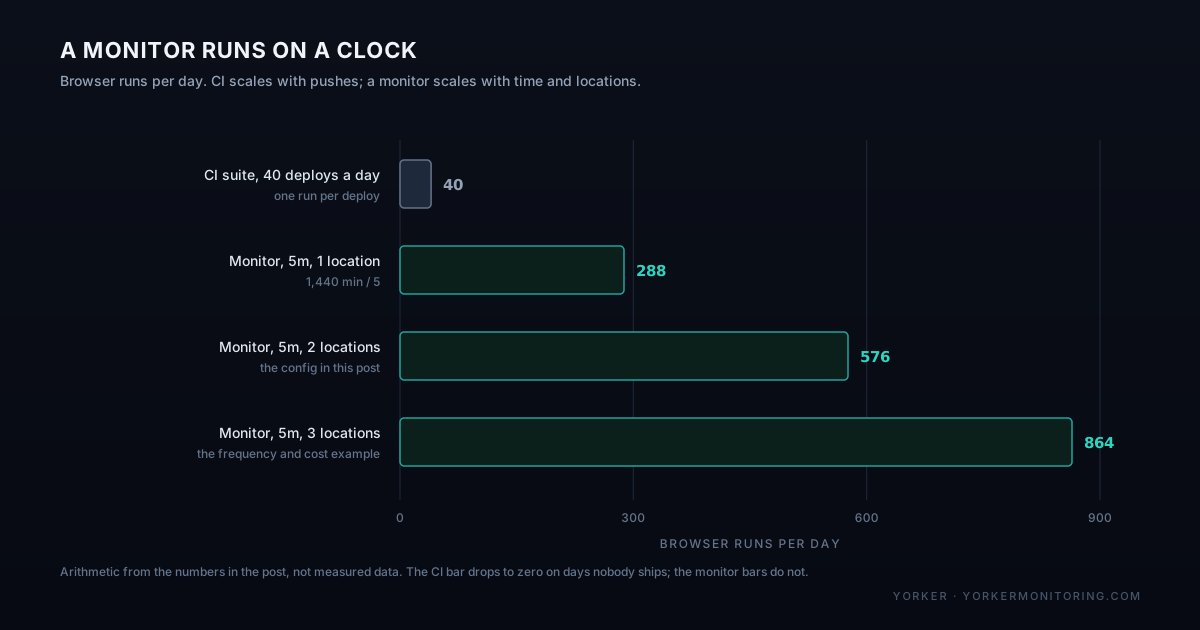
Frequency and cost. A test suite runs when someone pushes code: bounded by commit volume, usually free or close to it inside your CI minutes. A monitor runs on a clock, independent of whether anyone shipped anything. A checkout journey checked every five minutes from three locations is 864 browser sessions a day, every day, whether or not a single line of code changed. That's a real, ongoing compute cost, and it's why synthetic monitoring products meter browser runs.
Flakiness tolerance. A CI test can retry. Playwright's built-in retry, or a job re-run, absorbs a one-off network blip because a human is about to look at the result anyway before merging. A monitor that pages someone for a flake that resolved itself thirty seconds later teaches the team to ignore the next page, which is worse than the flake. So a monitor needs a different kind of tolerance: confirm the failure happened more than once in a row, and ideally from more than one location, before anyone gets woken up.
Network vantage point. A CI runner sits inside your CI provider's network, often in the same cloud, sometimes the same region as the thing it's testing. It tells you almost nothing about DNS resolution, CDN edge behaviour, or transit latency for a user in Singapore. A monitor's job is to sit where your CI runner doesn't: on real internet paths, in the regions your users are in.
What a failure means. A failed test means "don't merge this." It's a gate, aimed at the person who wrote the change. A failed monitor means "this is happening to users right now," and it lands on whoever's on call. Same red X, different obligation.
A practical model: one journey, two execution contexts
The model I'd build around: define the user journey once, and accept that it runs in two harnesses with different guardrails around each.
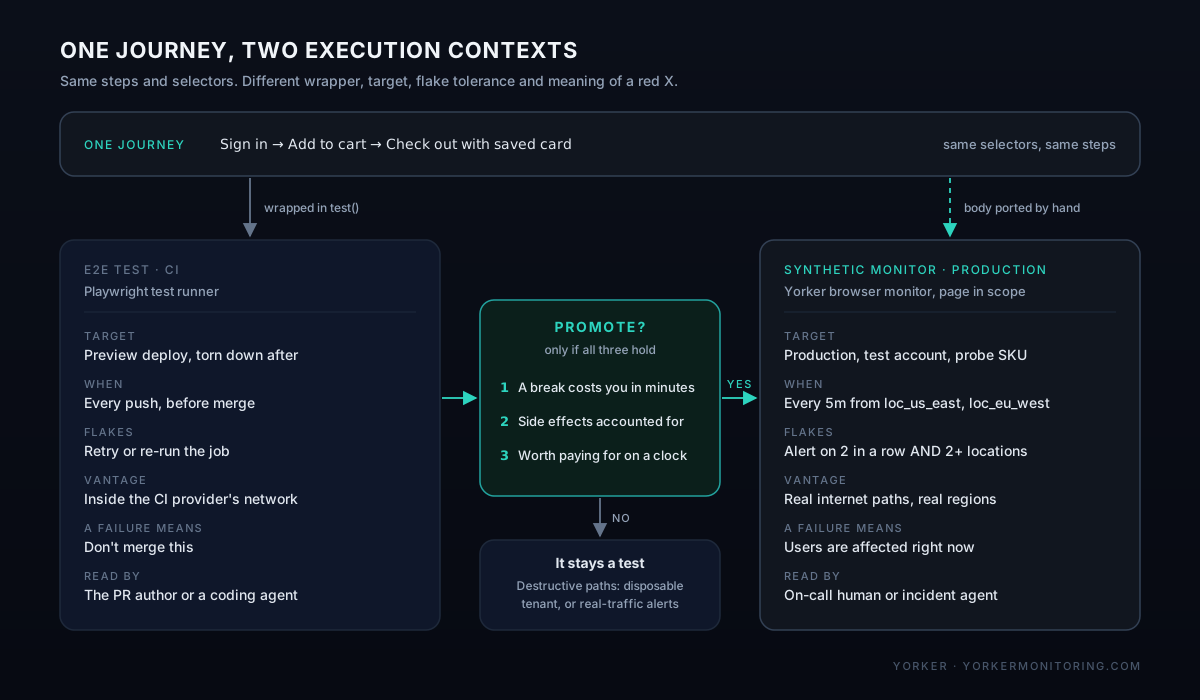
Write the journey as a normal Playwright test first, because that's where it earns its keep on every pull request:
// tests/checkout.spec.ts
import { test, expect } from "@playwright/test";

const baseUrl = process.env.BASE_URL ?? "http://localhost:3000";
const email = process.env.TEST_ACCOUNT_EMAIL!;
const password = process.env.TEST_ACCOUNT_PASSWORD!;

test("checkout completes for a signed-in user", async ({ page }) => {
  await page.goto(`${baseUrl}/login`);
  await page.fill('[name="email"]', email);
  await page.fill('[name="password"]', password);
  await page.click('button[type="submit"]');
  await page.waitForURL(`${baseUrl}/account`);

  await page.goto(`${baseUrl}/products/probe-sku`);
  await page.click("text=Add to Cart");
  await page.waitForSelector('[data-testid="cart-count"]');

  await page.click("text=Checkout");
  await page.click("text=Use saved card");
  await page.click('button:has-text("Place order")');
  await expect(page.locator("text=Order confirmed")).toBeVisible();
});Base URL from an environment variable, test account from a secret, a reserved SKU instead of real inventory, no destructive step. It runs on every PR against a preview deploy, and it runs locally with npx playwright test when you're debugging a failure.
Not every journey deserves to graduate past that. The ones that do meet three conditions at once: a break in this path costs you something measurable within minutes, not by the next sprint; you can run it against production without leaving side effects you can't account for; and you're willing to pay for it to run on a clock, from more than one place, indefinitely. Login and checkout usually clear that bar. "Change your notification preferences" usually doesn't. If a journey doesn't clear all three, it stays a test.
Where this actually lands
I build Yorker, a synthetic monitoring tool, so weigh the rest of this post accordingly. The model above holds whichever monitoring tool sits on the other side of it.
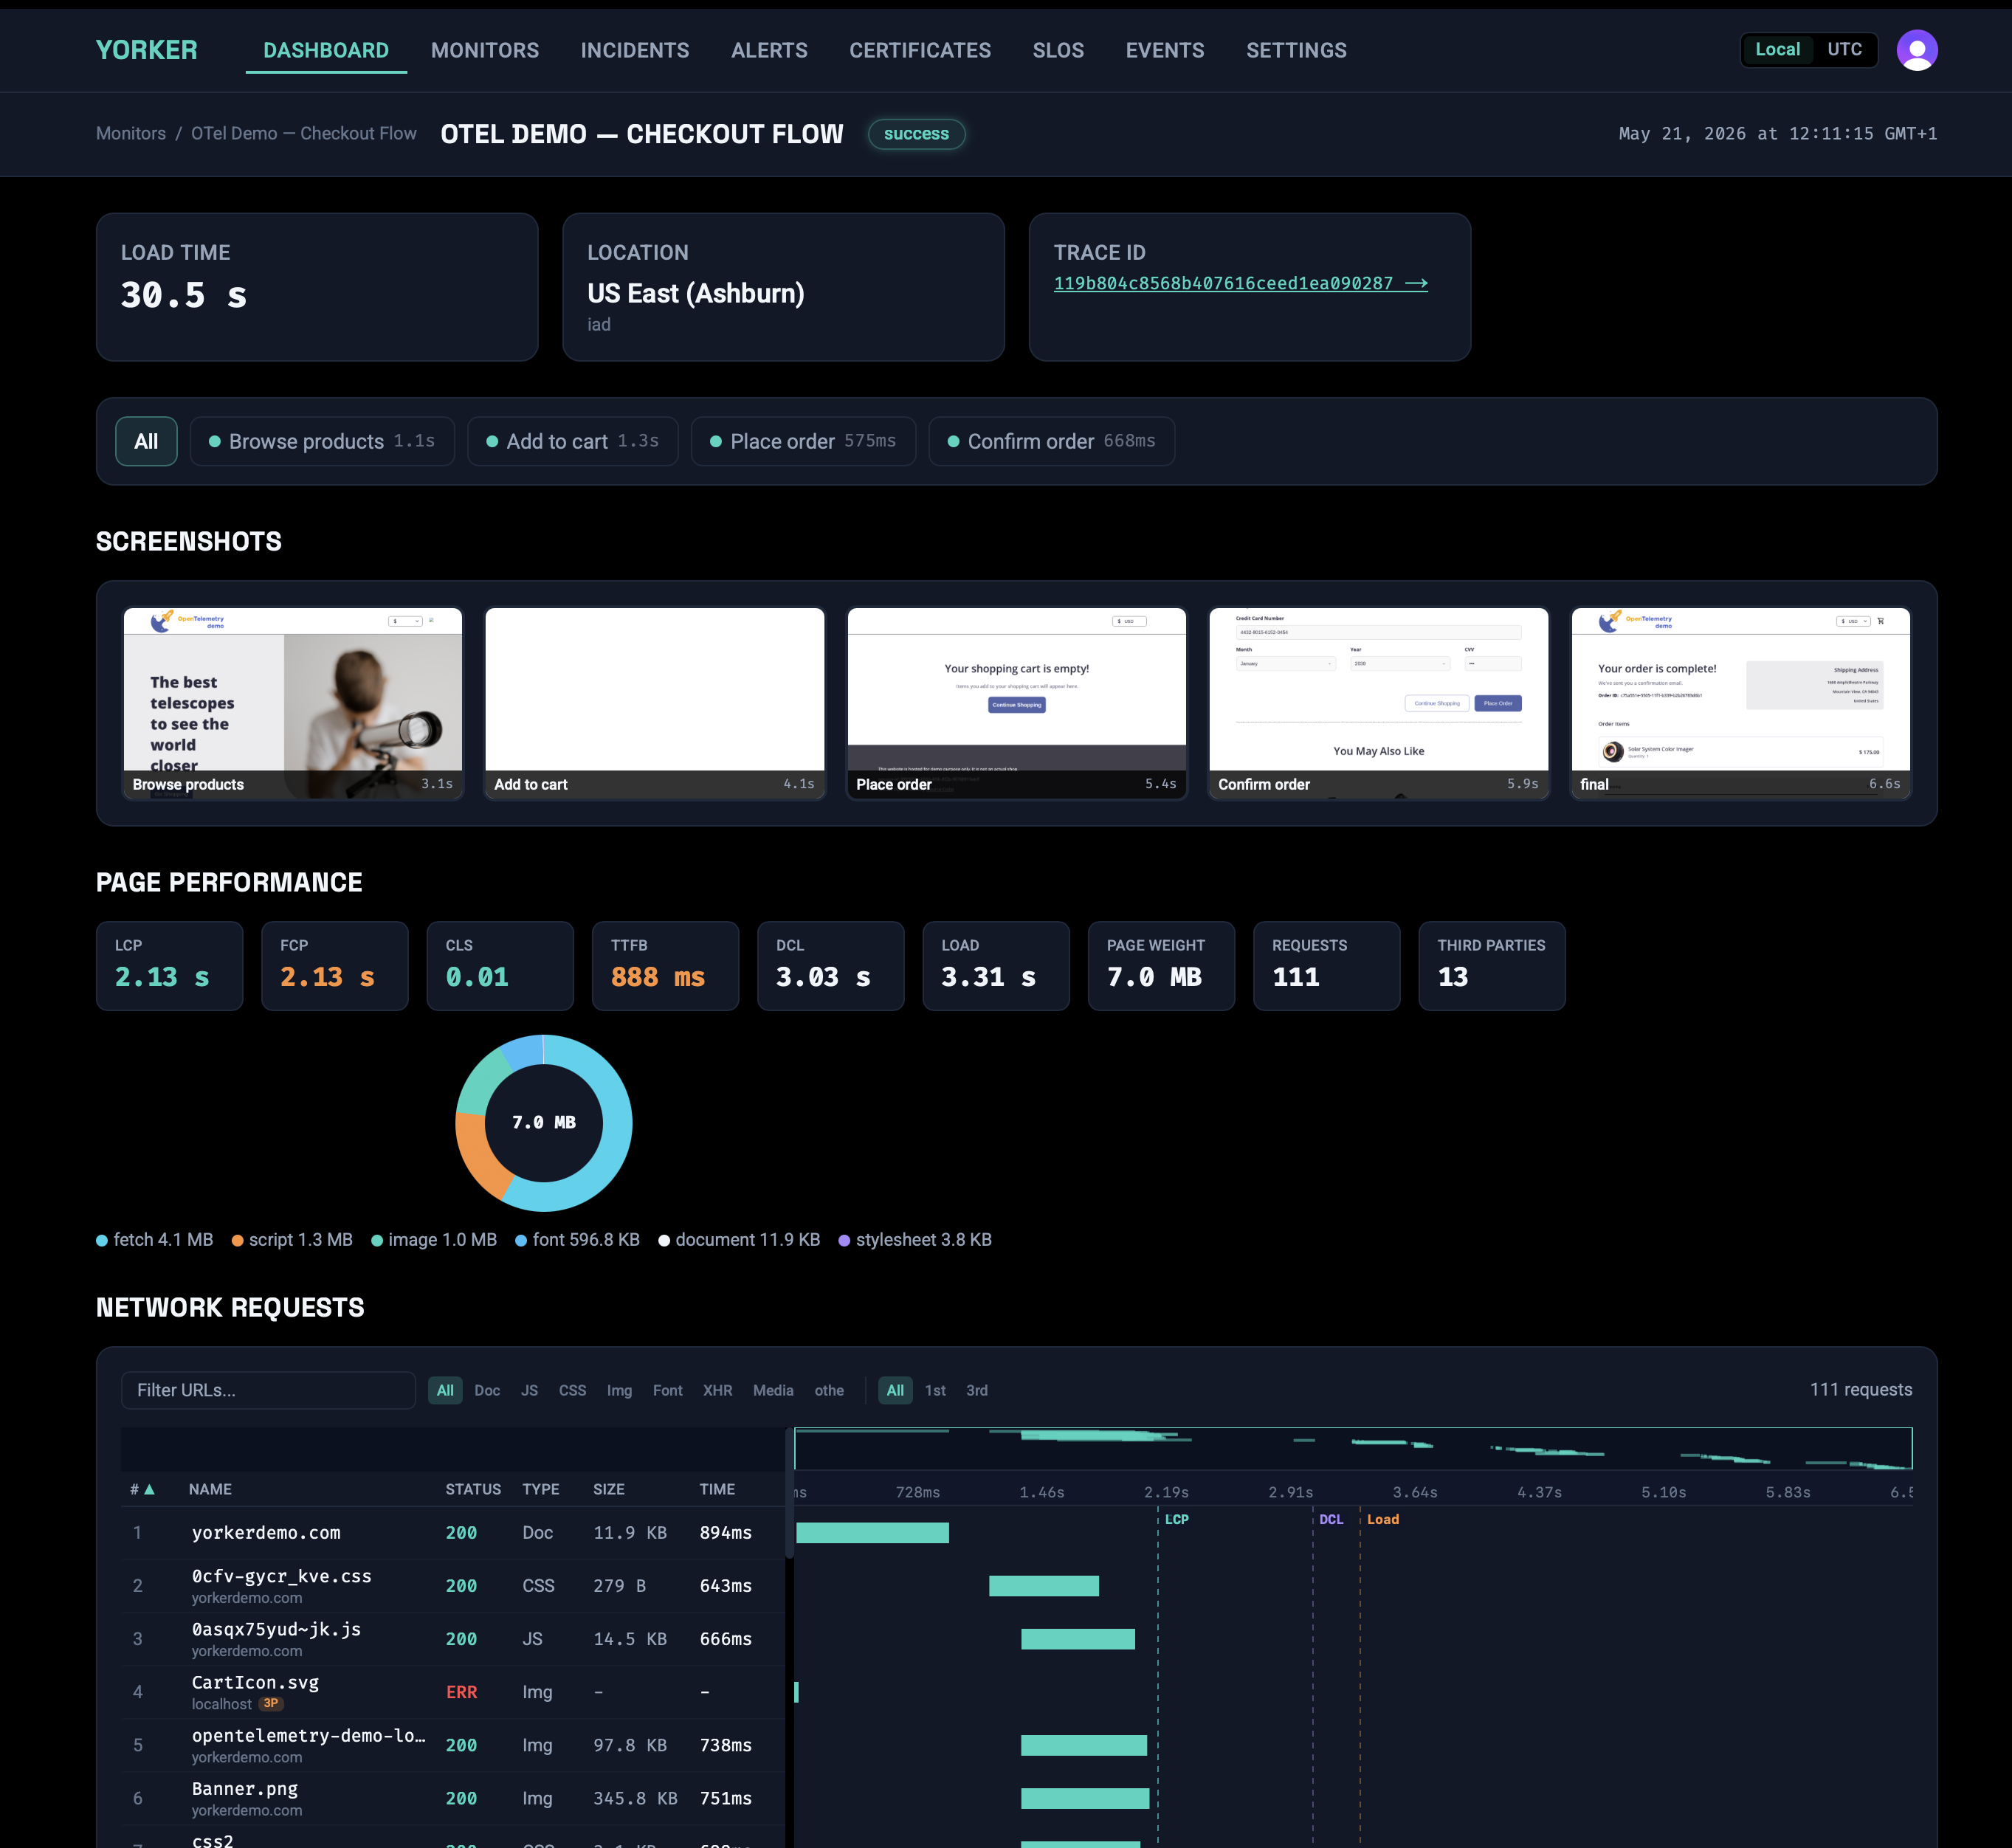
When a journey graduates, the promoted version keeps the test file's selectors and steps, with the wrapper stripped off. Yorker runs browser monitor scripts as a Playwright library, not through the Playwright test runner: no import statements, no test() or describe() blocks, because the script has no module scope. page and context are already in scope, and // @step: Name comments mark the points where the filmstrip captures a screenshot. That constraint is real: you can't literally import the test file into the monitor. You port the body over by hand (or with a small generation script if you want single-sourcing), and the two stay in sync because the same engineer who touches one touches the other.
// monitors/checkout.ts
// Runs inside Yorker's runner. page/context are already in scope.

const baseUrl = "{{env.BASE_URL}}";
const email = "{{secrets.PROD_TEST_ACCOUNT_EMAIL}}";
const password = "{{secrets.PROD_TEST_ACCOUNT_PASSWORD}}";

// @step: Sign in
await page.goto(`${baseUrl}/login`);
await page.fill('[name="email"]', email);
await page.fill('[name="password"]', password);
await page.click('button[type="submit"]');
await page.waitForURL(`${baseUrl}/account`);

// @step: Add to cart
await page.goto(`${baseUrl}/products/probe-sku`);
await page.click("text=Add to Cart");
await page.waitForSelector('[data-testid="cart-count"]');

// @step: Check out with saved card
await page.click("text=Checkout");
await page.click("text=Use saved card");
await page.click('button:has-text("Place order")');
await page.waitForSelector("text=Order confirmed");{{secrets.PROD_TEST_ACCOUNT_PASSWORD}} and {{env.BASE_URL}} are resolved at deploy time from your environment, the same secret interpolation syntax used across yorker.config.yaml. The reserved SKU and the "saved card" that never hits a real payment processor are the side-effect plan from earlier, made concrete.
The yorker.config.yaml entry is where the flakiness-tolerance and network-vantage-point differences show up as config, not prose:
monitors:
  - name: "Checkout flow"
    type: browser
    script: ./monitors/checkout.ts
    frequency: 5m
    locations:
      - loc_us_east
      - loc_eu_west
    timeoutMs: 60000
    alerts:
      - conditions:
          - type: consecutive_failures
            count: 2
          - type: multi_location_failure
            minLocations: 2
        channels:
- "@ops-slack"Conditions on an alert rule are ANDed, so this only pages when the flow has failed twice in a row and failed from more than one region, which is the multi-location confirmation a monitor needs that a single CI retry doesn't give you. Full condition types are in the configuration reference.
Locally, yorker validate and yorker test confirm the config and secrets resolve before you deploy anything. yorker test only executes HTTP checks directly; browser monitors are listed with their step markers so you can sanity-check the script, but the actual run happens remotely:
$ yorker test
Running monitors locally...

  Browser Checkout flow (3 steps)
    1. Sign in
    2. Add to cart
    3. Check out with saved card
Browser monitors require remote execution: use `yorker deploy` then check resultsFrom there it's the same loop as any other infrastructure-as-code change: yorker diff on the pull request that adds monitors/checkout.ts, so the deploy plan shows up as a PR comment before anyone approves it, and yorker deploy on merge to main applies it. The CI/CD guide has the full GitHub Actions and GitLab CI wiring for that validate-diff-deploy sequence.
Same journey and steps in two harnesses, with a documented seam where the wrapper changes and the guardrails get stricter. Anyone selling you on "one script for testing and monitoring" who can't tell you exactly where it splits hasn't run it in production yet.