Your monitoring data is security data

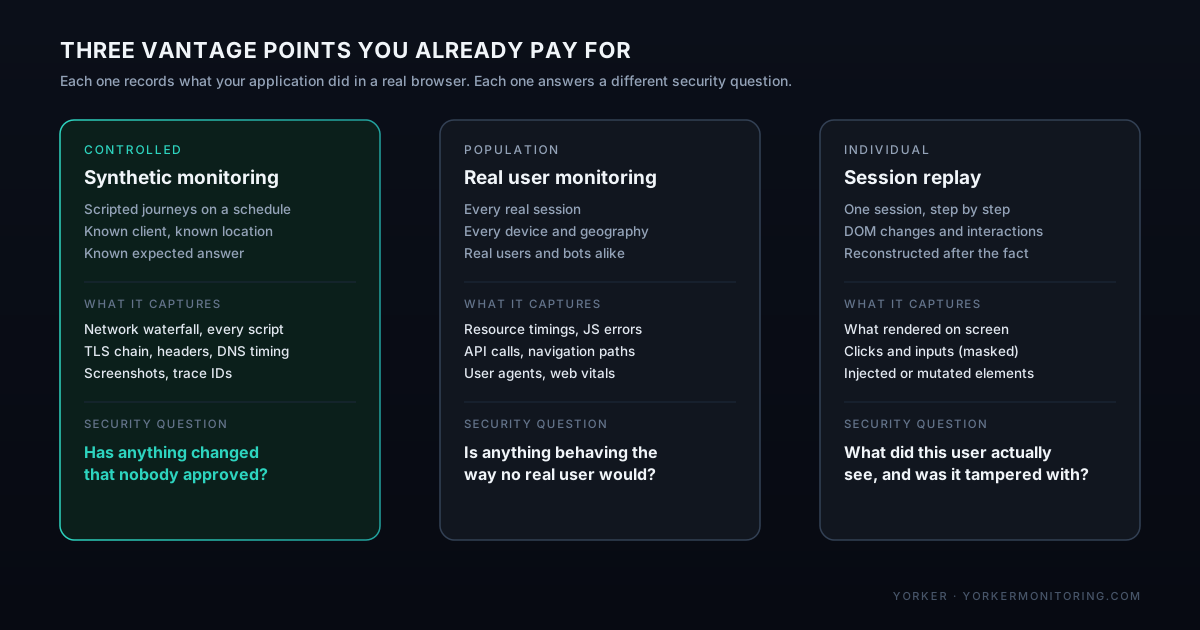
Most organisations already run three kinds of digital experience monitoring. Synthetic checks load the site from a scripted browser every few minutes. Real user monitoring (RUM) records every page load and API call from real visitors. Session replay reconstructs what individual users saw and clicked. The budget for all three usually sits with engineering, SRE or ecommerce, and the justification is uptime and conversion.
Between them, those tools hold a continuous, browser-level record of how the application behaved. Network, endpoint and cloud telemetry tell you what reached your servers. Experience data tells you what your customers actually received, and that is a place most security tooling can't see.
In most organisations, the security team has never looked at any of it.
Why the security team never sees it
Nothing technical stops security from using this data. The obstacles are budgets, org charts and habits.
- It's bought by someone else. Experience monitoring is purchased and owned outside security, and nobody in the purchase conversation asks what the SOC could do with the output.
- It lands in a different store. Experience data goes to an observability backend. Security data goes to a SIEM or security data lake. The two rarely share schemas, identities or retention policies, so correlating them means a manual export.
- It's labelled as performance. A new third-party script shows up as "page weight increased by 40 KB". A certificate swap shows up as a change in TLS handshake time. The security meaning is in the record, just not in the label.
- Ingest pricing discourages it. When SIEM cost scales with gigabytes, high-volume RUM data is the first thing left out, even though a small filtered slice of it would carry most of the security value.
- Privacy controls were built for engineers. Session replay is masked and access-restricted for good reasons, but those controls rarely anticipate a security investigation, so the SOC is either locked out or not trusted to be let in.
Vendors have been circling this gap for years. Elastic has sold observability and security on the same platform since it launched Elastic SIEM in 2019. Datadog has built Cloud SIEM and application security alongside its monitoring products. Cisco bought Splunk, Palo Alto Networks bought Chronosphere, and SentinelOne (Observo AI) and CrowdStrike (Onum) have both bought telemetry pipeline companies. Having both products under one logo hasn't, by itself, put experience data in front of the security team. Someone still has to decide which signals matter and route them there.
Seven places experience data earns its keep in security
Every example below uses data a typical enterprise already collects. What changes is who looks at it, and what they're looking for.
1. Client-side supply chain attacks
A modern checkout page can load dozens of scripts from third parties, and any of them can be modified at source. In 2018 attackers altered a single JavaScript file on British Airways' booking site and skimmed card details from more than 400,000 customers over about two weeks; the ICO fined the airline £20m. In June 2024 the new owner of the polyfill.io domain started serving malicious code to more than 100,000 websites that had embedded it.
Server-side controls don't see this kind of attack, because the malicious code never touches your infrastructure. It runs in the customer's browser.
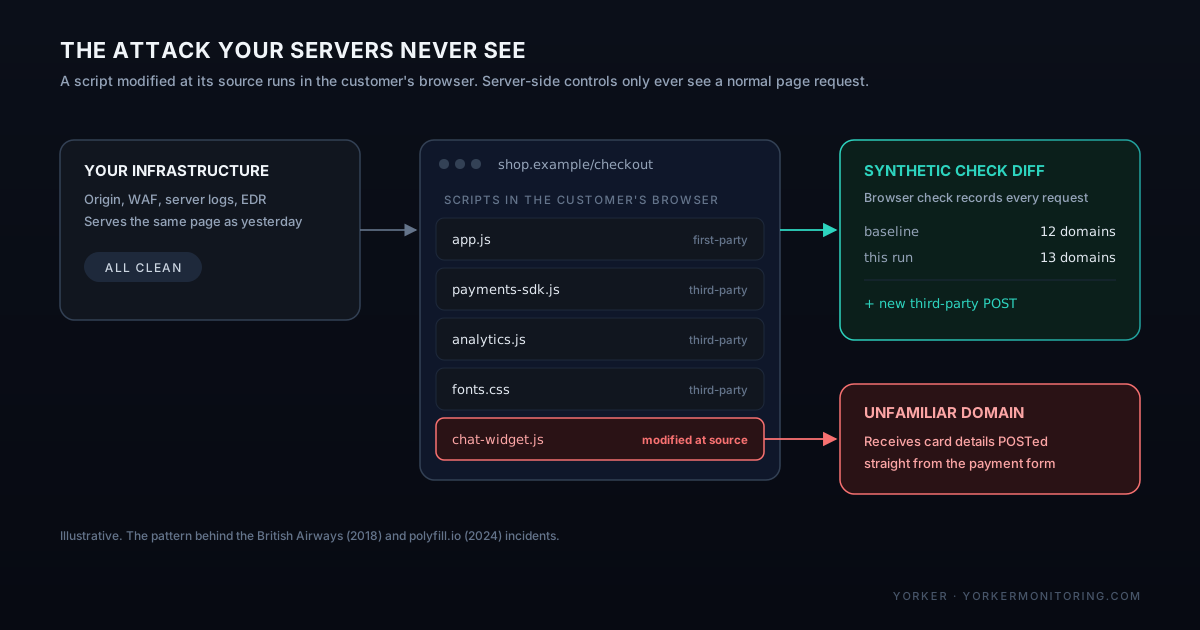
A synthetic browser check loads the page the way a customer does and records every request in the network waterfall. A new domain, a changed script, or a script that suddenly posts to an unfamiliar host is a diff against a known baseline. RUM sees the same thing across the whole population, including variants served only to certain regions, devices or user agents, which is how skimmers typically hide from scanners.
There's a compliance reason to care as well. PCI DSS 4.0 requirements 6.4.3 and 11.6.1, mandatory since 31 March 2025, require an inventory and integrity check of every script on a payment page, plus alerting on unauthorised changes to those scripts and to HTTP headers. Much of the evidence for both already sits in synthetic and RUM data.
2. Account takeover, credential stuffing and bots
RUM records how sessions behave, as well as what they request. Credential stuffing leaves recognisable patterns: login calls with no rendered login page before them, navigation faster than any person could manage, headless browser user agents, missing web vitals, and bursts from a narrow set of networks against login and password reset.
A WAF or bot manager sees requests. RUM can tell you whether a real browser rendered the page before the request arrived. A spike in login API calls with no matching spike in rendered login pages is a strong signal on its own.
3. DNS, certificate and CDN tampering
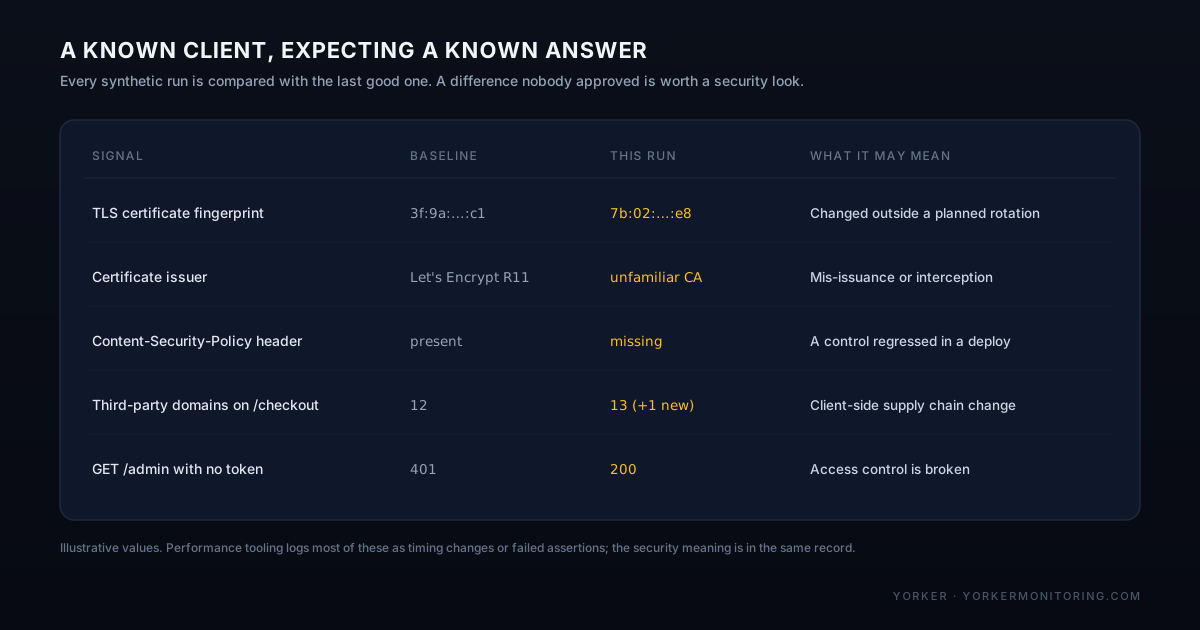
A synthetic check is a known client, at a known location, expecting a known answer. That makes it a good tripwire for infrastructure-level attacks that customers would never think to report:
- DNS resolving differently from one region than from the others, which is consistent with DNS hijacking or route manipulation.
- A TLS certificate whose fingerprint or issuer changed outside a planned rotation, or an unfamiliar certificate authority appearing in the chain.
- A CDN edge serving different content, headers or scripts to one location than to the rest.
- A defaced page caught in a screenshot before anyone posts about it.
4. Finding the API surface you actually expose
Security teams usually inventory APIs from gateways, specs and code scanning. RUM inventories them from the client side: every endpoint the shipped front end calls in production, including deprecated versions, undocumented internal APIs and third-party calls nobody wrote down. The gap between those two lists is where shadow and zombie APIs live.
5. Checking that security controls still work
Most security controls get tested once, at deployment or audit time, and are then assumed to hold. A synthetic check can verify them every few minutes instead:
- The admin endpoint still returns 401 without a token.
- Content-Security-Policy and Strict-Transport-Security headers are present and unchanged.
- The login flow still asks for MFA.
- The WAF still blocks a harmless test payload.
The same checks that page someone when checkout gets slow can page someone when a control quietly regresses after a deploy.
6. Fraud and forensics
When a customer disputes a transaction or reports a phishing overlay, session replay can show exactly what they saw: an injected form field, a fake payment modal, a DOM element that had been tampered with. Very few other data sources can reconstruct the user's screen, and with the right controls around it, replay gives a disputed fraud case real evidence to work from.
7. Pivoting from the browser to the backend
Synthetic and RUM tools increasingly propagate the W3C traceparent header, which links a client-side event to the distributed trace it triggered, and from there to backend logs and database calls. For a SOC analyst that's one step from "this session looked wrong" to everything the backend did for it.
Beyond the browser: agents and APIs
For most of its history, "experience" meant a person in a browser. More and more of the clients that matter are now software: AI agents calling tools over MCP, and integrations calling your API with no browser involved. The known-client, known-answer idea carries over to both, and the security questions are just as pointed.
MCP servers are your agents' third-party scripts
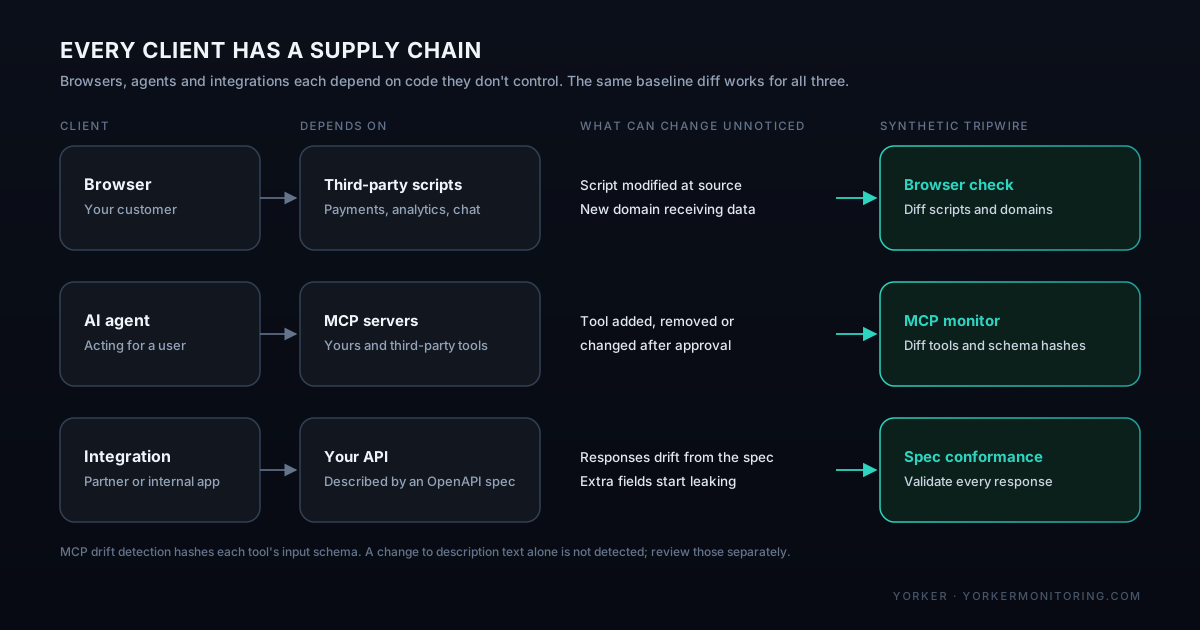
A checkout page runs code from third parties, and an agent does much the same when it calls tools from MCP servers, some of them yours and many of them not. Those tool definitions aren't fixed. In April 2025 Invariant Labs described tool poisoning and "rug pull" attacks, where a server changes a tool after a client has already approved it. A new tool appearing on a server your agents already trust, a tool gaining an extra parameter, or a tool vanishing are all changes that nobody reviewed.
A synthetic MCP monitor connects the way a client does: it initialises a session, lists the tools and makes test calls. It can record a hash of each tool's input schema and flag tools that were added, removed or modified since the last run, which is the same baseline diff as a script inventory, applied to the agent's dependencies.
There's a gap to be clear about. The attacks Invariant published hide their instructions in a tool's description text, and a hash of the input schema won't notice a change that only touches the description. Treat tool descriptions like code: review changes to them, and watch them separately if your monitoring doesn't.
Access control applies here too. An MCP endpoint that accepts sessions with no credentials is exposed to anyone who finds it. A plain HTTP check that sends an initialize request without credentials and expects a 401 turns "this server requires auth" into something you verify every few minutes.
Your API spec is a security baseline
An OpenAPI spec is a written statement of what your API should return. Conformance monitoring calls the live API and validates each response against that spec, failing on status codes the spec doesn't define and on bodies that no longer match the schema.
That has a direct security use. OWASP API3:2023 covers APIs that return object properties the caller shouldn't see, such as an internal flag, a password reset token, or another user's email address. If your schemas are strict (additionalProperties: false), a response that suddenly carries extra fields fails conformance, and the monitor becomes a tripwire for data exposure. With loose schemas those extra fields pass silently, so tightening the spec is part of the control.
Generating one check per operation from the spec keeps the whole documented surface under continuous test. Put that next to the client-side API inventory from RUM in use case 4 and you get both halves of the comparison: what you documented and what's actually being called. For operations that need auth, a copy of each check with the credentials removed, expecting a 401, covers the other half of the contract.
Collect once, route twice
The expensive parts of any security data source are instrumentation, collection and retention. For experience data all three are already paid for out of someone else's budget: the RUM snippet is on every page, synthetic journeys run around the clock, and the results already sit in an observability backend for weeks or months.
That leaves routing and analysis as the only real new cost. The trap is copying everything into the SIEM. The better pattern is one OpenTelemetry pipeline feeding both teams from the same records, with the full volume staying in observability and a filtered, security-relevant slice going to the SOC.
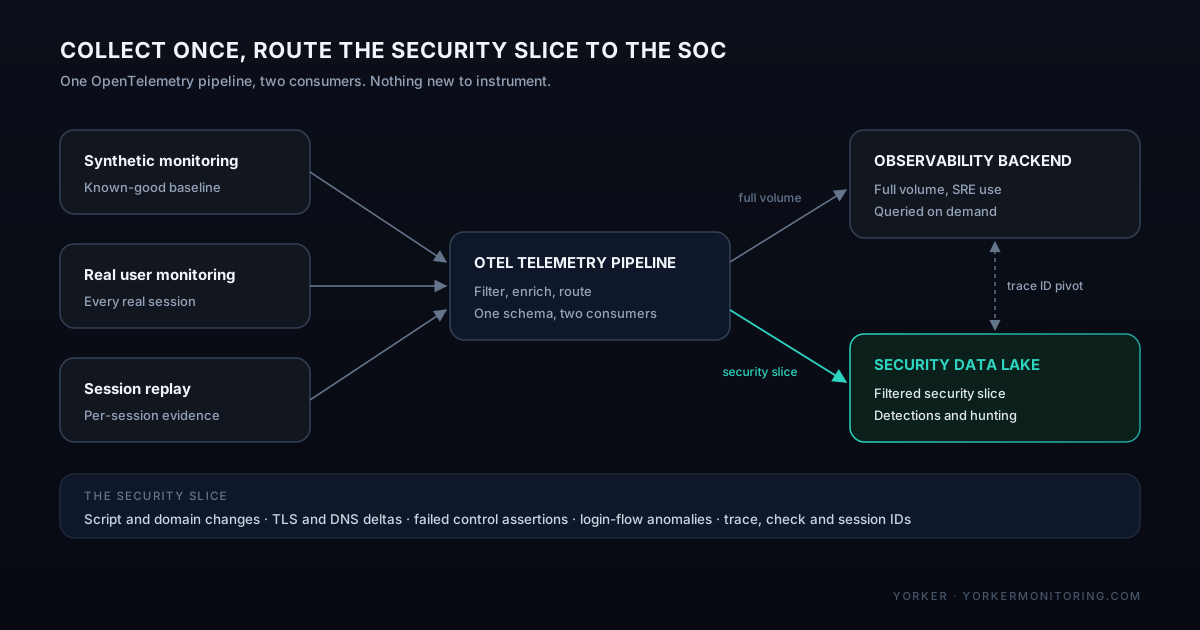
Three things make this work in practice:
- Standardise on OpenTelemetry. OTLP is vendor-neutral, so the same signal can land in an observability backend and a security data lake without bespoke connectors or a second agent.
- Label security events at the source. Emit "new third-party domain on checkout" or "certificate fingerprint changed" as records in their own right, instead of leaving them buried in performance metrics.
- Keep the pivot. Carry trace IDs, check IDs and session IDs on every security record, so an analyst can get back to the full-fidelity data without anyone copying it into the SIEM.
It's the same reasoning behind all those telemetry pipeline acquisitions: filter in the pipeline and pay to store and analyse only what earns its place. Experience data suits that approach well, with high volume, low average value, and a small subset that is very valuable indeed.
Using it without turning the SOC into surveillance
RUM and session replay describe what real people did, so using them for security raises the bar on privacy. Get this wrong and you lose the trust of customers, regulators and your own engineers.
- Be clear about purpose. Record the security purposes in your privacy notice and record of processing. Under GDPR and UK GDPR, reusing data collected for performance monitoring needs a compatible purpose and a legitimate interest assessment.
- Mask at capture. Form inputs, payment fields and free text shouldn't leave the browser unmasked, and a security use case is no reason to relax that. Most of the signals above (script inventories, domains, timings, navigation patterns) don't need personal data at all.
- Use synthetic where it's enough. Synthetic checks involve no real users, so they carry almost no privacy cost. Use them for baselines, tripwires and control checks, and keep RUM and replay for population-level detection and individual investigations.
- Gate replay access. SOC access to replay should be tied to an open case, logged and time-limited, like any other sensitive evidence store.
- Alert on patterns. Detections should fire on behaviour across many sessions rather than on a single identifiable user, unless an investigation is already open.
- Know where the data goes. Many monitoring vendors process results in their own cloud before forwarding them. Check what leaves your perimeter, and don't assume a "private" collection point means data never passes through a vendor.
What Yorker covers, and what it doesn't
Yorker is a synthetic monitoring platform, so it covers the controlled, known-good part of this picture. It doesn't do RUM or session replay. Several things it already records map straight onto the use cases above:
- Playwright browser checks capture the full network waterfall, with each request classified as first-party or third-party, which is the raw material for spotting client-side supply chain changes.
- Every run records the TLS certificate's fingerprint, issuer and chain, and you can alert on a certificate change, an untrusted or invalid chain, a self-signed certificate or a deprecated protocol.
- Assertions on status codes, response headers and body content turn "the admin endpoint needs a token" and "CSP is present" into checks that run every few minutes.
- Screenshots and filmstrips from each browser run give you visual evidence when a page changes.
- MCP monitors run a real client session against your MCP servers, hash each tool's input schema, and can alert when a tool is added, removed or modified. They don't hash tool descriptions.
- OpenAPI conformance checks validate live responses against your spec, and Yorker can generate one check per operation from the spec itself.
- Every check propagates
traceparent, and results go out as standard OTLP to whatever backend you choose, including a security data lake.
Nothing in Yorker labels these as security detections for you today. The data is there as standard OpenTelemetry; deciding what counts as suspicious, and building the detection on top, is still work for your security team.
Where to start
This is a joint project for whoever runs security and whoever runs observability, and it doesn't need any new collection.
- List every synthetic, RUM and replay tool you run, who owns it, what it captures and how long it keeps data.
- Add the MCP servers your agents depend on and the APIs you publish specs for. Few security teams have either on a list.
- Map what each one captures against the seven use cases above. Most teams find they already have the raw material for several.
- Agree the privacy position with your DPO before any data moves.
- Pick one use case first. Script changes on payment pages is usually the best choice: the threat is well documented, PCI DSS 4.0 makes it an audit item, and synthetic checks cover it without touching personal data.
- Send the security slice to the SOC over OTLP, write one detection and one response playbook, and run a tabletop exercise with a simulated malicious script.
- After a quarter, compare detection time, false positives and ingest cost against where you started, then add a second use case.
Most of the data this needs is already being collected and paid for. The work is getting it in front of the security team.