Synthetic monitoring is changing, and most tools didn't notice
Every few years the question changes. Not the tooling, the question. The thing an engineer actually wants to know when they set up synthetic monitoring has moved three times in three decades, and the category has mostly answered the previous question slightly better each time instead of the new one. We built Yorker because the question changed again and the answer on offer is still a version of the old one.
This is the short history of how synthetic monitoring got here, why the current generation of tools is structurally stuck, and where we think it goes next.
Era one: is the site up
The question, roughly 1995 to 2008: is my site reachable right now, and will you wake me when it isn't.
Keynote launched in 1995. Gomez followed soon after. Pingdom, the one most people remember, has been running since around 2007. The product was a periodic HTTP or ping check from a handful of external probes, an uptime percentage, and an alert when the number went red. For a static site that was the whole job, and these tools did it well.
They could not tell you whether a user could actually log in, search, and check out, because they never tried. A single request to a URL is not a user. As web apps got richer, "the homepage returned 200" stopped meaning "the application works."
Era two: do the user journeys work
The question, roughly 2008 to 2016: do my critical flows complete, how fast, and from where, and why did one break.
Catchpoint was founded in 2008, explicitly to fix the limits of the previous generation. Scripted browser transactions, mostly Selenium-driven, replayed multi-step journeys: log in, add to cart, pay. Probe networks grew to dozens of locations. The data got richer: waterfalls and page timing, not just an up bit.
Then synthetic stopped being something you bought on its own. New Relic, AppDynamics, and Dynatrace folded synthetic into their APM suites, because a failing scripted transaction is far more useful when you can pivot straight into the backend trace that explains it. That correlation was a genuine improvement. It also quietly set the trap for the next era: to get the correlation, your synthetic data had to live inside one vendor's platform.
Era three: one signal in one platform
The question, roughly 2016 to 2022: show synthetic next to my traces, metrics, logs, and real-user data so I can tie a failed check to the deploy that caused it.
In 2017 Peter Bourgon's "metrics, tracing, and logging" post crystallised the three-pillars framing, and every observability vendor built the all-in-one platform that synthetic got slotted into. Datadog shipped Synthetics alongside RUM in 2019, positioned as one correlated signal in the Datadog platform. Checkly, founded around 2018, made the sharpest move of the era in a different direction: code-first monitoring as code, browser checks as real test files, versioned with your app. When Microsoft released Playwright in January 2020, Checkly's bet on it as the monitoring runtime defined the modern code-first approach.
This era produced the best synthetic tooling so far. It also hard-wired the assumption underneath all of it: synthetic is only valuable inside a platform that also owns your traces, metrics, and logs. The correlation that made era two better became the lock-in that defines era three. Your check data is only as portable as the vendor allows, and the good cross-signal experience only works if you buy the whole suite.
Era four: the backend stopped being the vendor's choice
Here is what actually changed, and why it is a category shift rather than a feature request.
Telemetry stopped being proprietary. OpenTelemetry was accepted into the CNCF in 2019, reached incubating status in 2021, and graduated on 11 May 2026, days before this post. OTLP is now the common wire protocol, and the backend is no longer one vendor's decision. Teams run the Grafana stack, ClickHouse and ClickStack, Honeycomb, SigNoz, Dash0, or a plain OpenTelemetry Collector in front of whatever they like. The "single platform for everything" premise that era three was built on no longer matches how teams actually assemble observability.
At the same time the people doing this work moved into their terminals and their coding agents. Infrastructure is code. Monitoring config that lives in a vendor dashboard, invisible to a pull request, is now the exception that feels wrong, not the default.
So the question changed again: emit synthetic telemetry in a standard format, into whatever backend I already run, driven from code, with no platform tax for the privilege.
Look at how the category answers that today. Datadog Synthetics is a closed platform: you can export a CSV of test runs, but there is no path to stream raw synthetic telemetry as OTLP into a backend that isn't Datadog. Pingdom's OTel story exists only at the wider SolarWinds platform level, not for synthetic itself. Grafana has solid synthetic and k6, but it is tied to Grafana Cloud rather than backend-neutral. Checkly, the most modern of them, can export check results as OpenTelemetry spans, but it is a secondary capability bolted to a product whose centre of gravity is still Checkly's own platform. Uptrends has shipped a genuine OTLP export, and credit to them for it, but again as an add-on to a traditional synthetic tool, not as the product itself.
No incumbent leads with this as its identity. Backend-portable, OTLP-native synthetic monitoring with no platform lock-in is, as a primary positioning, essentially uncontested. Not because nobody can build it, but because it is hard to lead with "your data leaves and goes wherever you want" when the business model was built on the data staying.
Portability is necessary but it is not the whole job. Anyone can pump OTLP at a collector. The interesting question, once the data is portable, is what you can do with it before it lands. A raw firehose of synthetic results into your incident tool or your agentic RCA assistant is a context-window problem, not a debugging tool. The product work era four actually needs is on top of the telemetry, not under it.
Where Yorker fits
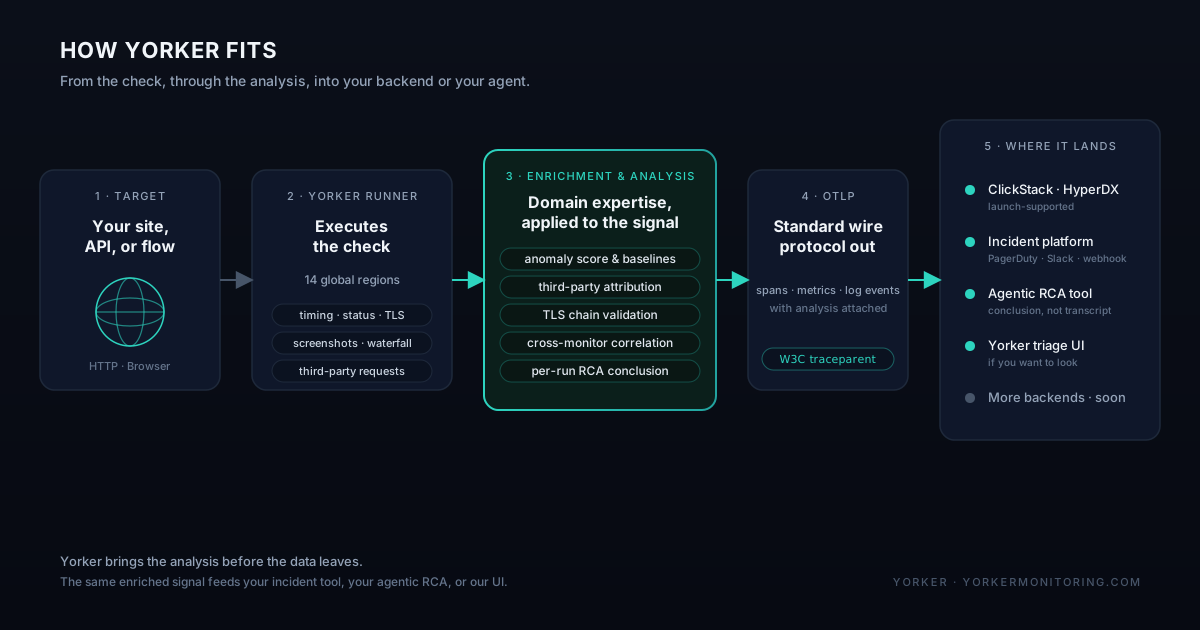
Yorker is built for era four as the starting point, not retrofitted to it, and the bet is bigger than "we speak OTLP." The bet is that synthetic monitoring should bring domain expertise to the signal before anything downstream sees it.
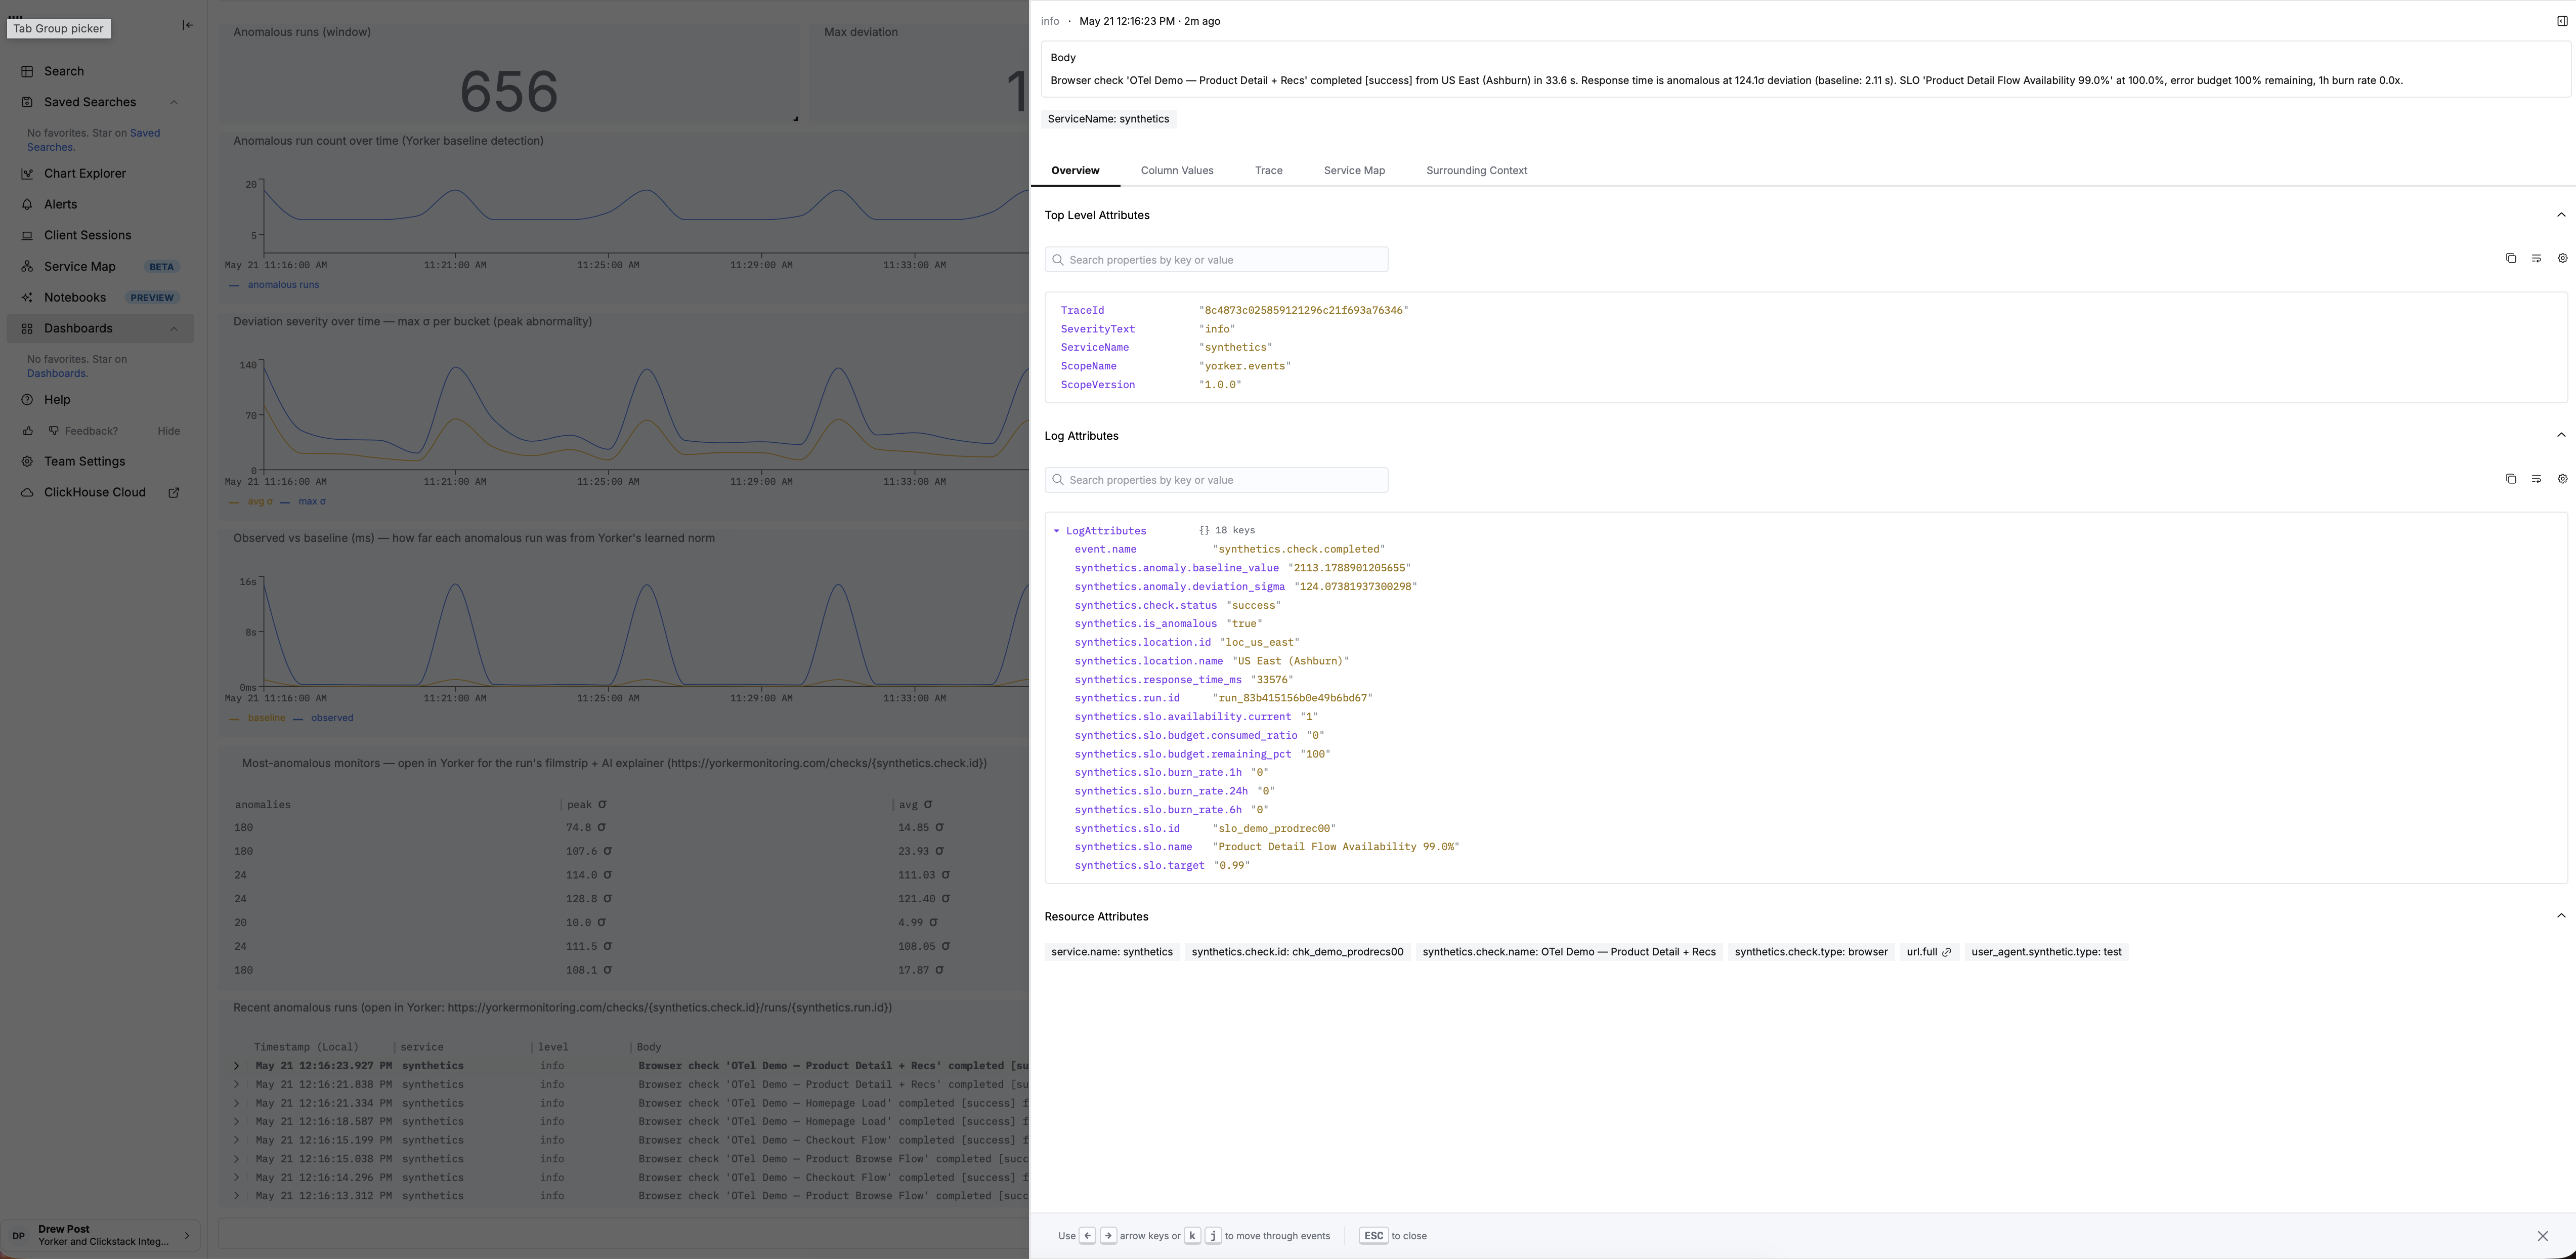
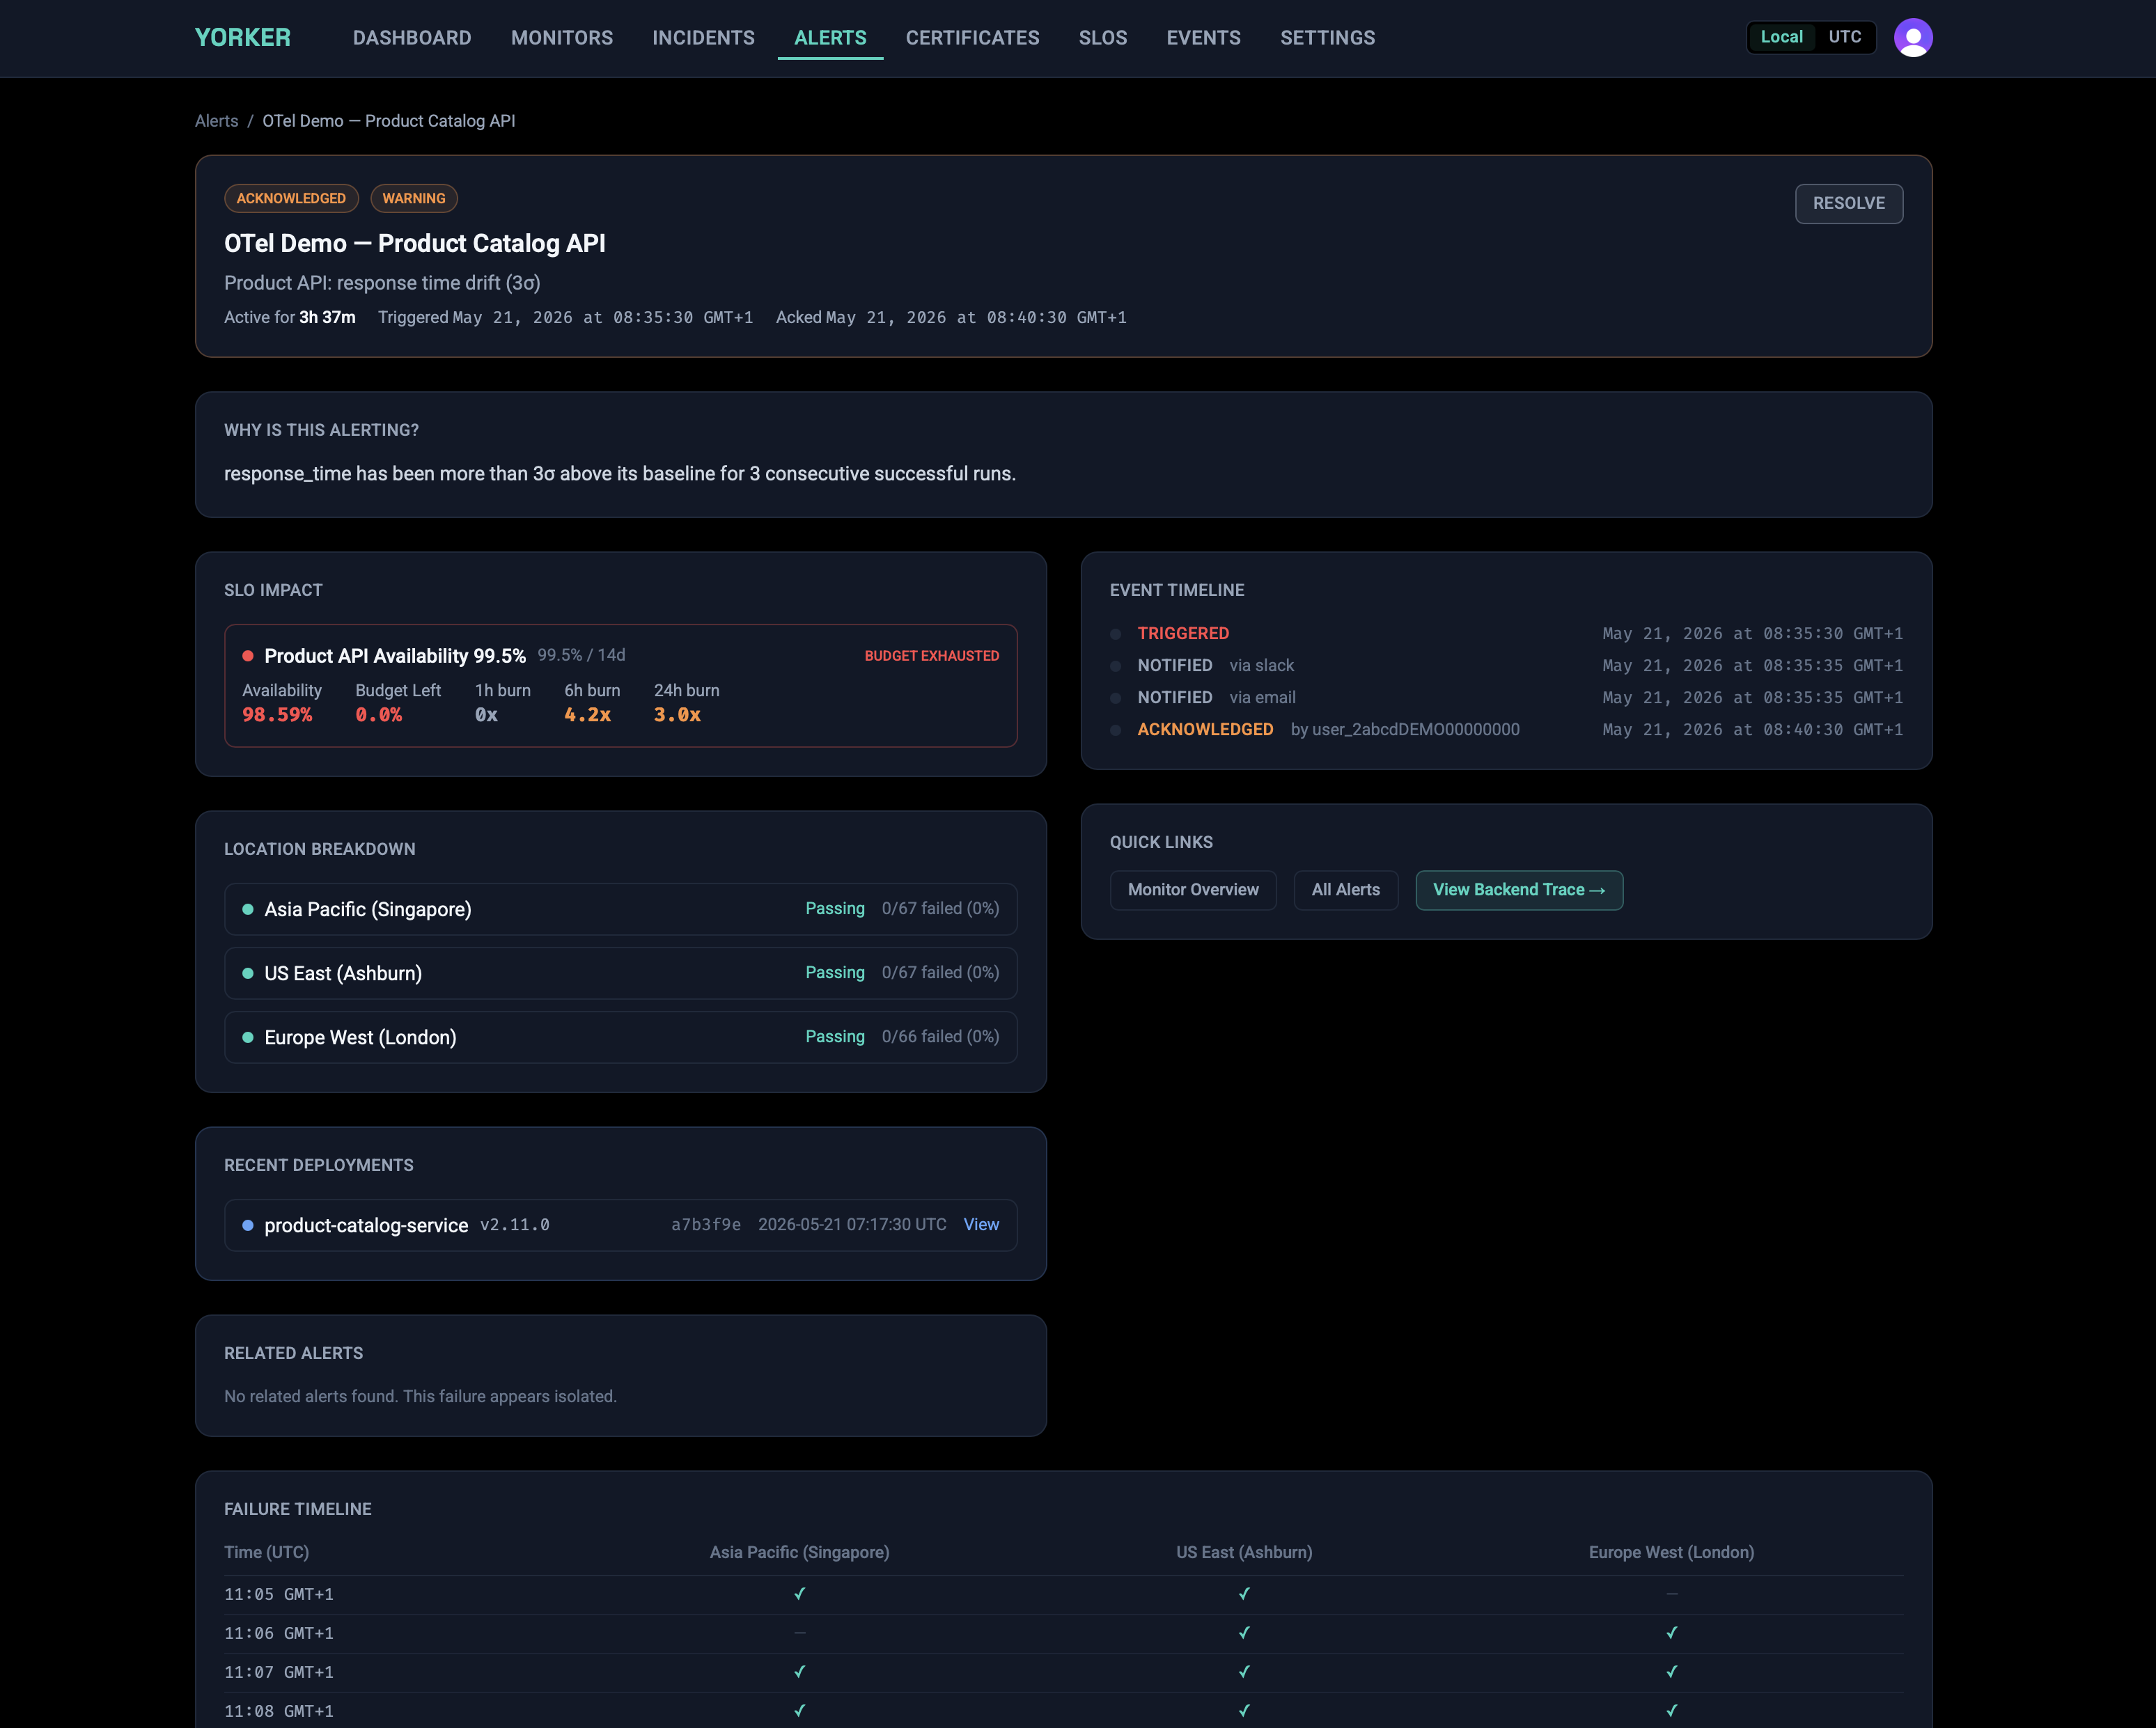
Every check run is enriched before it leaves the runner. Checks emit standard OpenTelemetry into the backend you already use, but the spans and log events on the way out carry analysis, not just measurement. Anomaly detection runs on every result against per-monitor and per-third-party baselines, and when a run deviates the synthetics.check.completed event carries the deviation in sigmas, the baseline value, and the affected dimension. Third-party dependencies are attributed and labelled on the synthetic span: the count, total bytes, and the specific domains involved. TLS certificate chains are walked end to end on every HTTPS check, not just the leaf. SLO budgets and burn-rate alerts are exported on the same OTel signal.
Correlation across monitors is computed at ingest. When two or more monitors fail in a five-minute window and observe the same third-party dependency, Yorker emits a synthetics.correlation.detected event with the affected check IDs already attached. Your incident tool finds out about a shared failure mode at the same time it finds out about the first symptom, not three dashboards later.
The traceparent header is the spine that ties this together. Yorker injects W3C trace context into every request, so a synthetic step becomes a real span in your application's distributed trace. Compose that with the third-party attribution on the synthetic span, the cross-monitor correlation events, and the dependency baselines, and you get a knowledge graph: synthetic monitor, frontend, backend services, and every third party the journey depends on, linked by the same join key your application traces already use. Your incident tooling can query that graph directly. So can your agentic RCA assistant, without you pasting a wall of JSON into a context window.
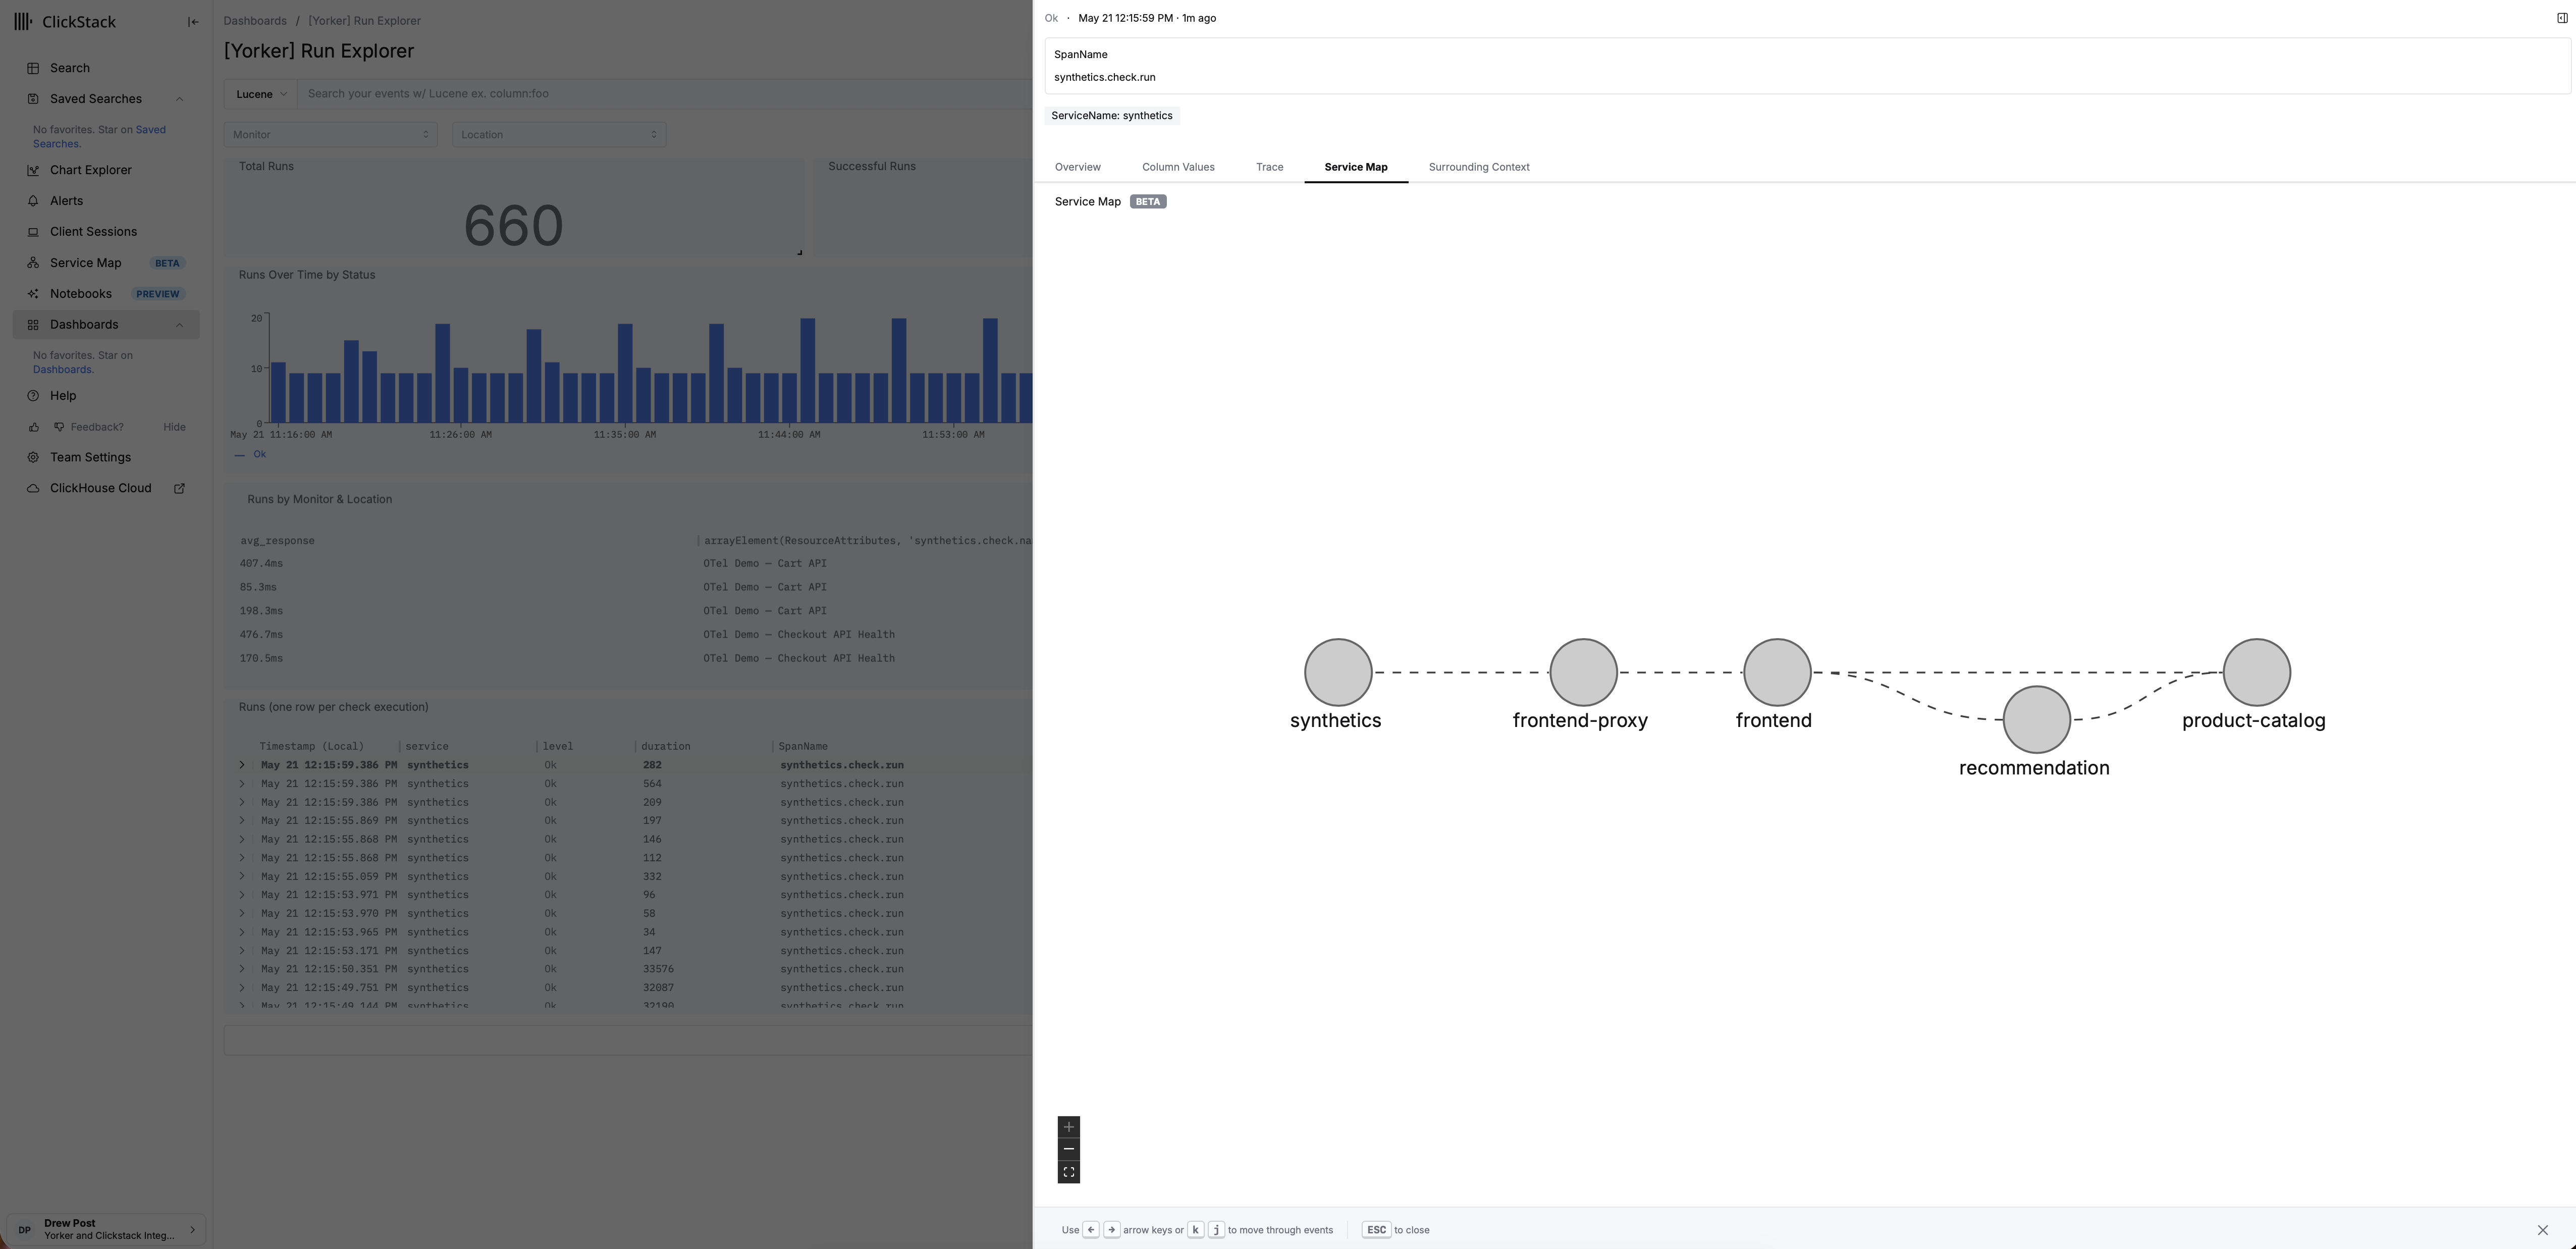
At launch, the analysed signal lands first-class in ClickStack Cloud and in self-hosted HyperDX or ClickStack. Anywhere OTLP is accepted is in scope, and the next certified targets are arriving quickly. We are starting with the stack where the OTel-native synthetic gap is most acute and the audience knows exactly what good looks like, then widening from there.
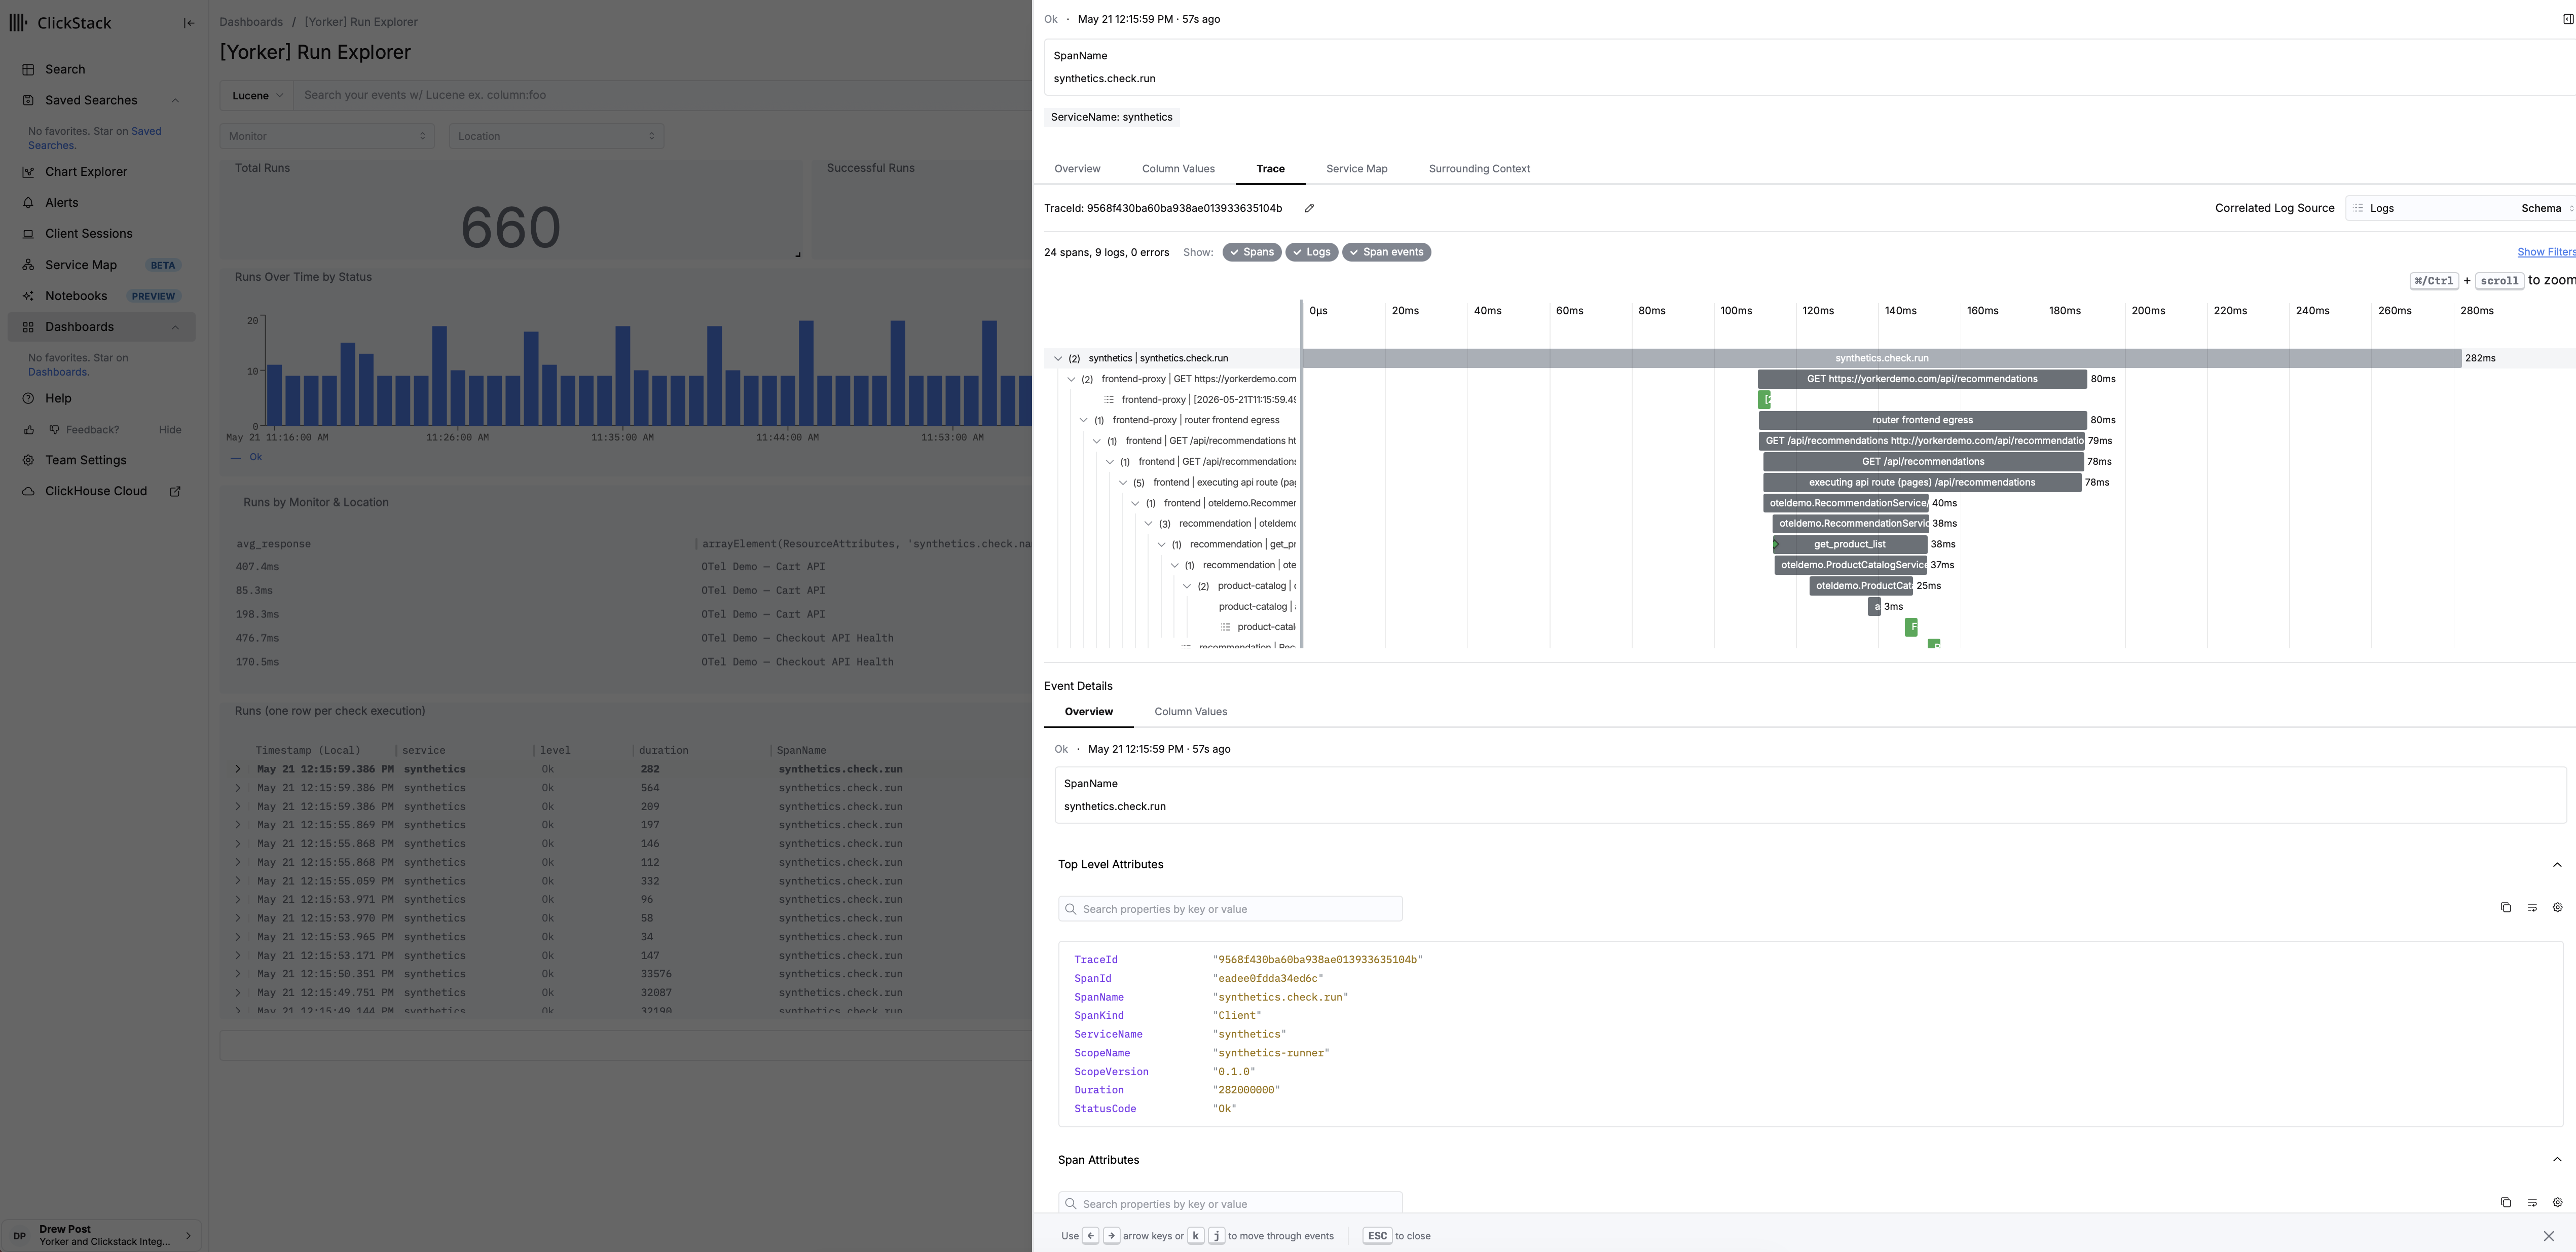
When a check fails, Yorker hands the downstream tool a conclusion, not a transcript. The per-run RCA pulls the suspect step, the failing assertion, the relevant network requests, the console errors that matter, and the third-party signals that line up, and produces a structured payload the next system in the chain can act on. Over longer windows, the yorker monitors analyze command produces a deep-analysis summary of a monitor's behaviour: when it has been flaky, which third parties have driven the variance, which deploys correlate with regressions. The same data goes to your incident platform, your agentic RCA tool, your terminal-resident coding agent, or Yorker's own triage UI if you want to look at it directly. Whichever consumer is on the other side of OTLP, the signal has already been reasoned about before it arrives.
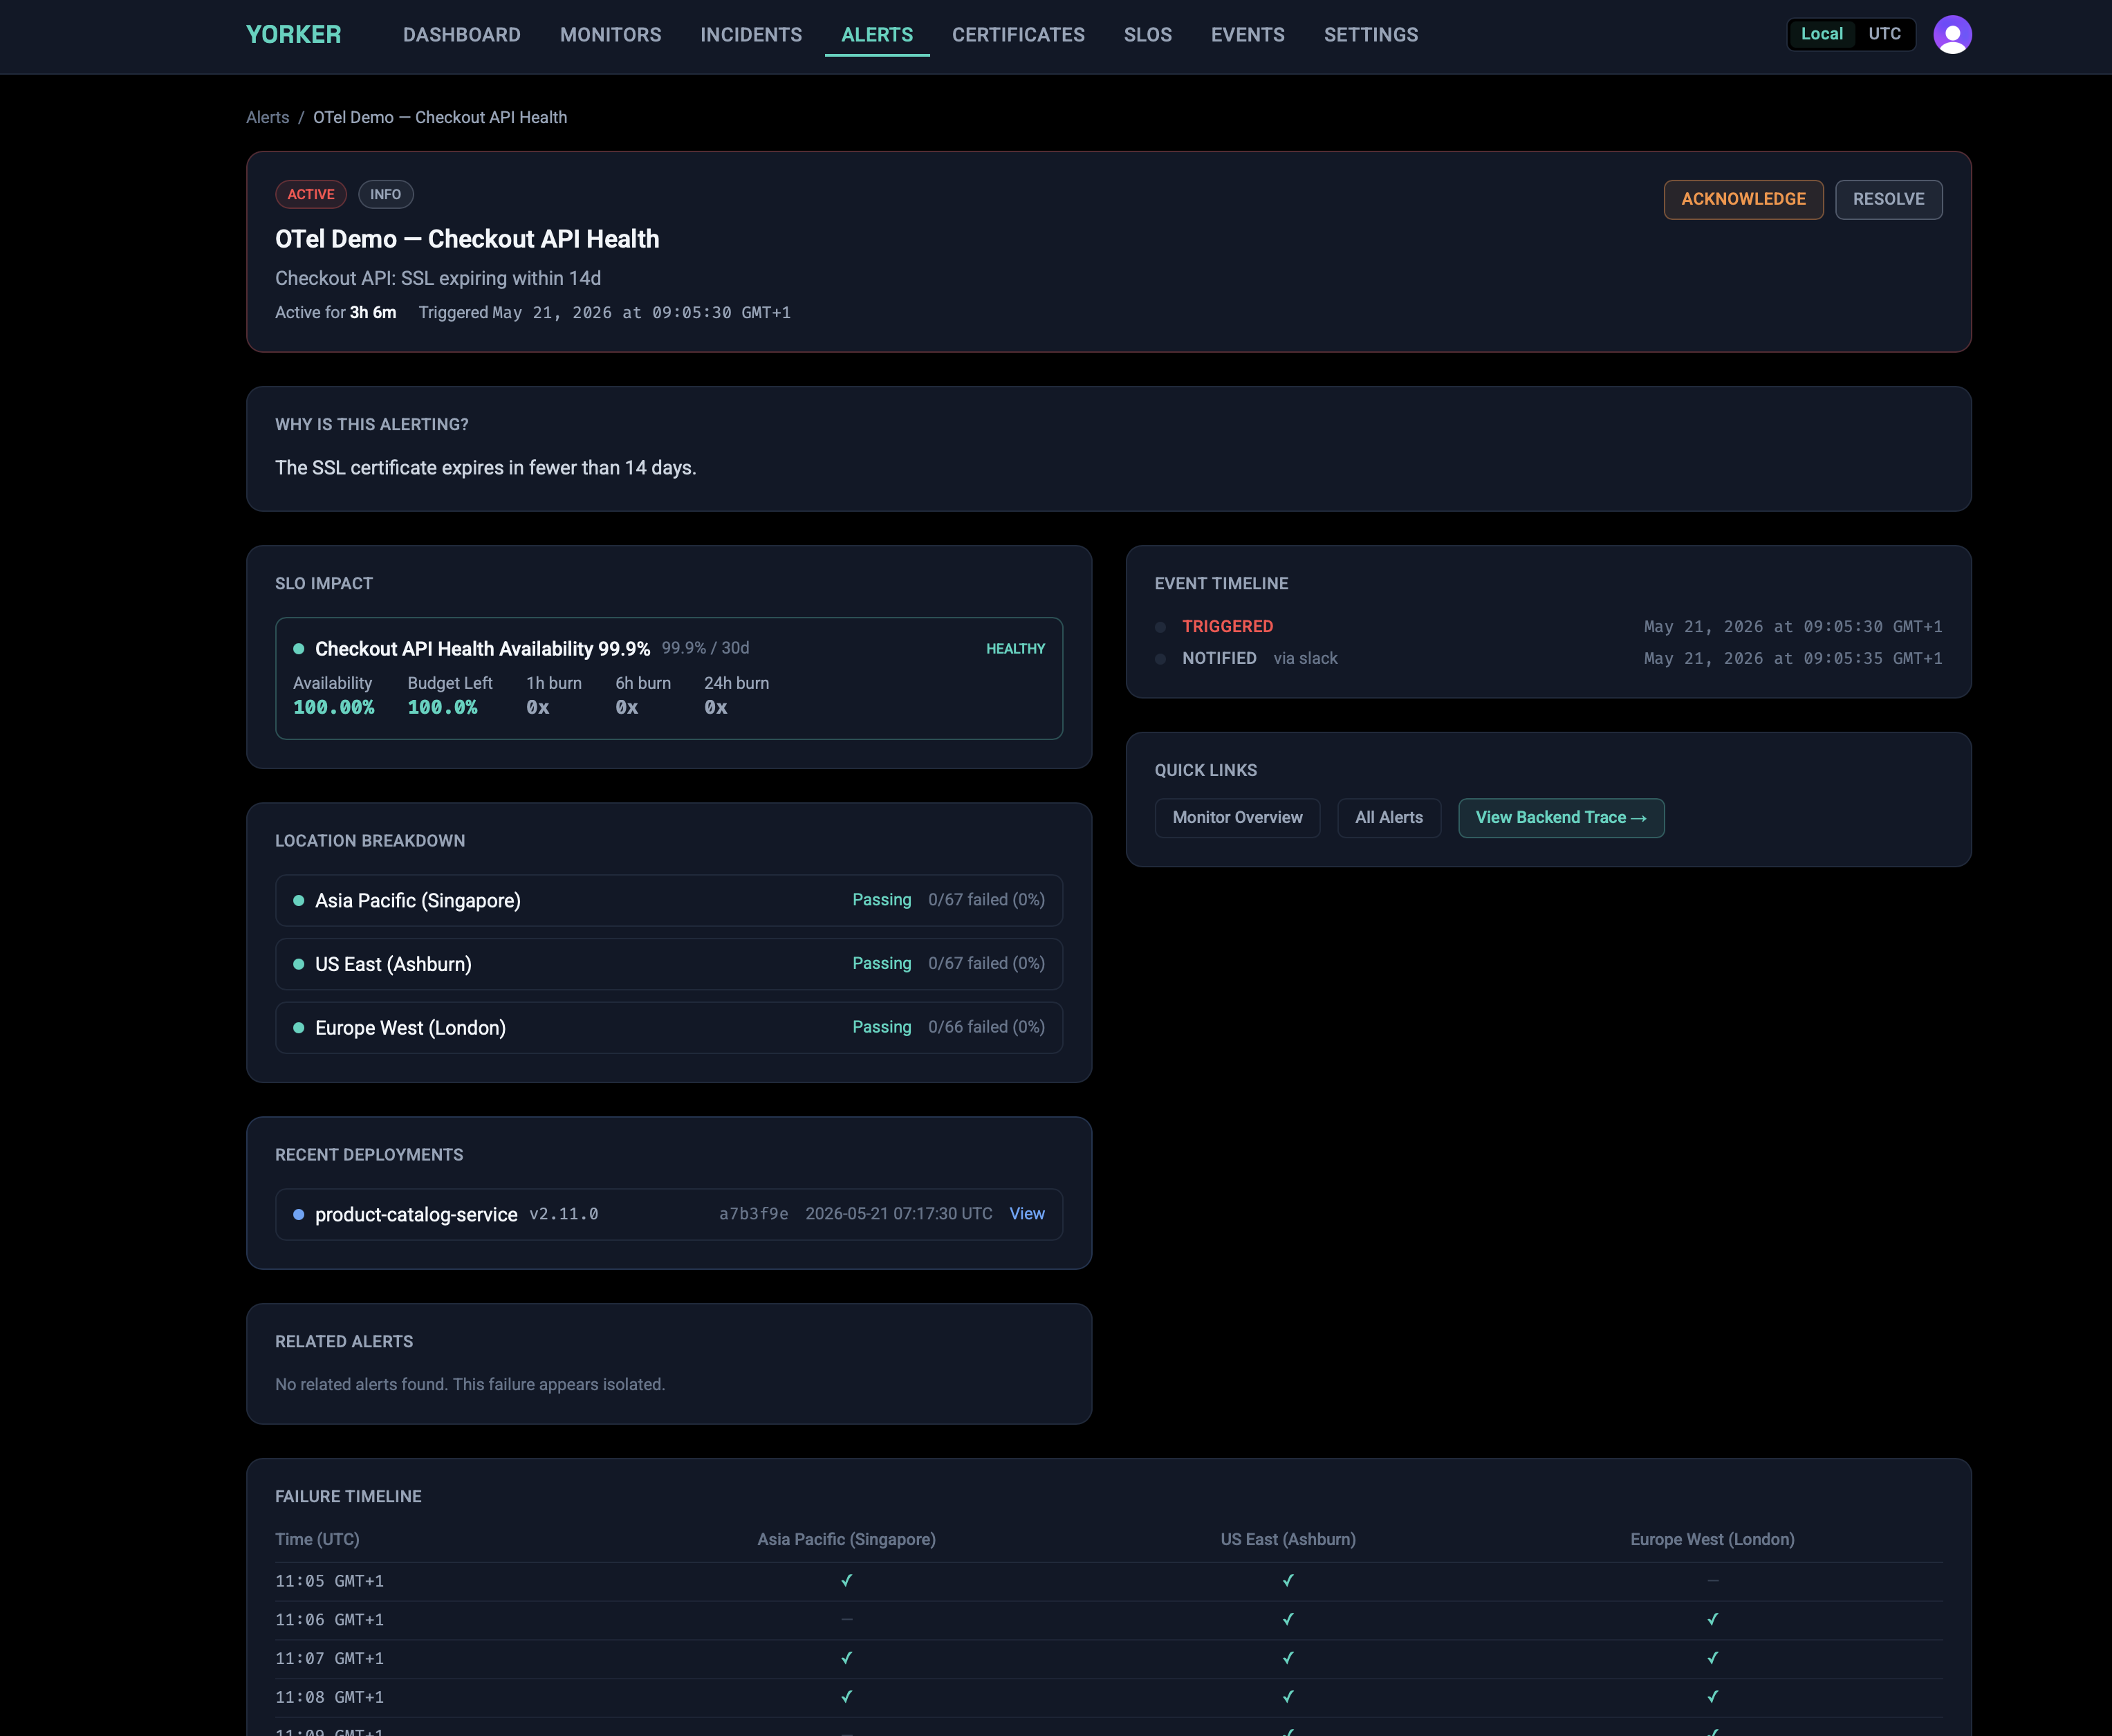
The base mechanics matter too, and they are real. The browser checks are vanilla Playwright, generated from a plain-language description of the flow when you want that, editable as ordinary code when you don't. We wrap Playwright, we don't fork it. When a browser check fails you get a screenshot filmstrip and a network timing waterfall, because an HTTP status code does not tell you what the user saw. The whole configuration is plain YAML in your repo, deployed with yorker deploy, reviewable in a pull request like everything else you run. It runs from 14 global regions, with a free tier that needs no credit card and is enough to evaluate against something real rather than a toy.
Monitoring from your terminal
The other half of era four is where engineers actually work. Infrastructure runs through terraform plan and kubectl apply, deploys through gh pr merge, incidents through a Slack thread and a terminal. Synthetic monitoring is one of the last config surfaces that still expects you to leave that workflow and click through a dashboard. So the yorker CLI is a first-class interface, not a wrapper around the web app.
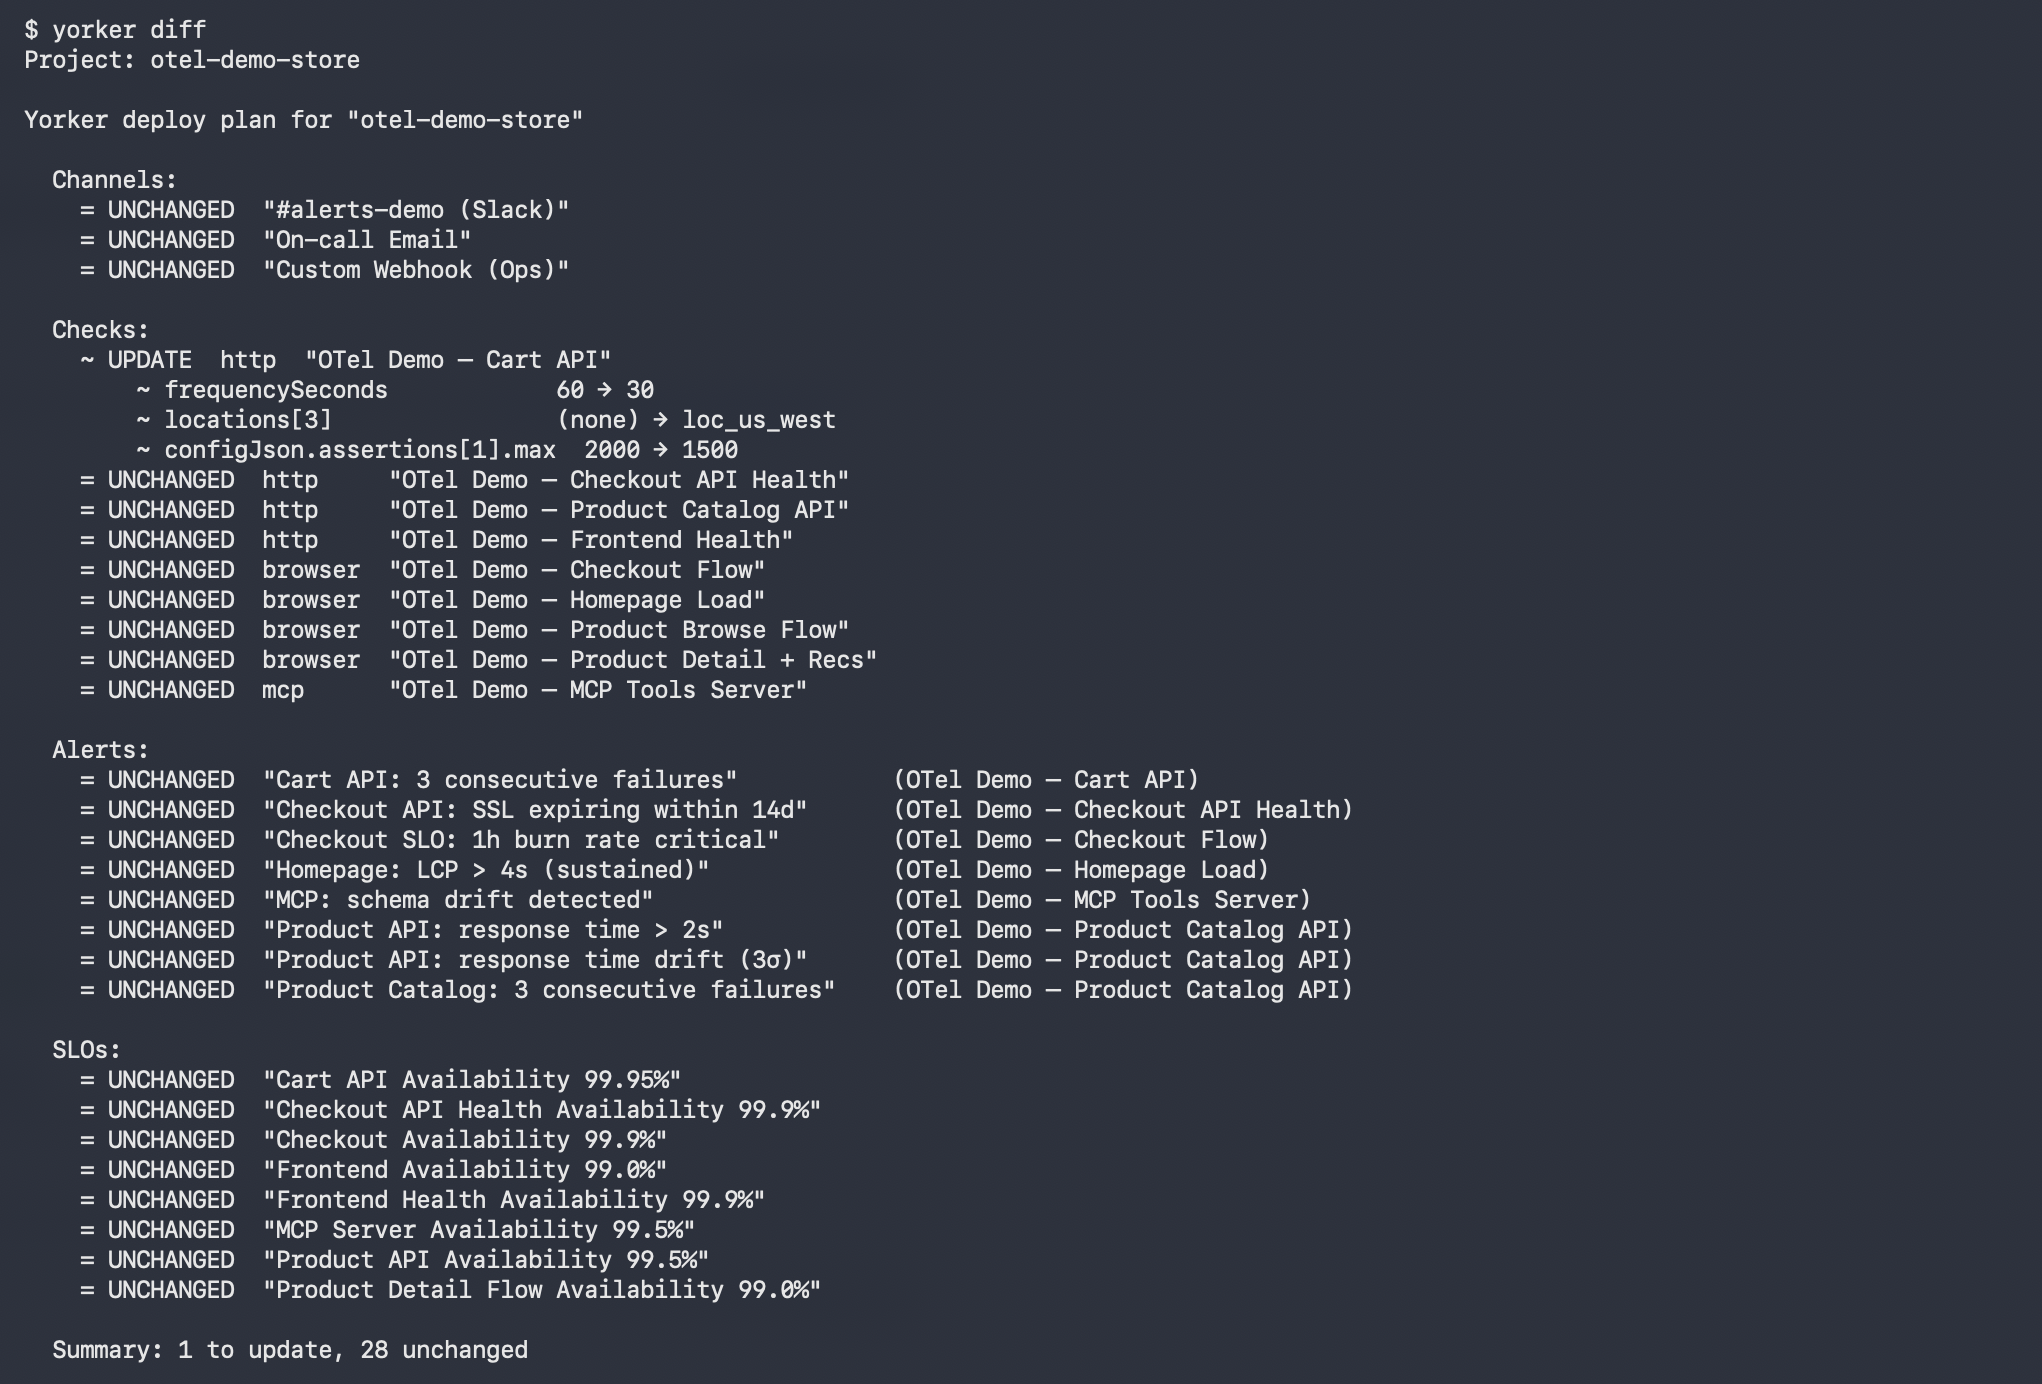
The loop is the one you already use for infrastructure. yorker.config.yaml lives next to your code. yorker diff shows a per-field plan against remote state. yorker deploy applies it. yorker pull re-exports remote state if someone has been editing in the UI. The same config you write locally is what runs in production, and the change log is your git history.
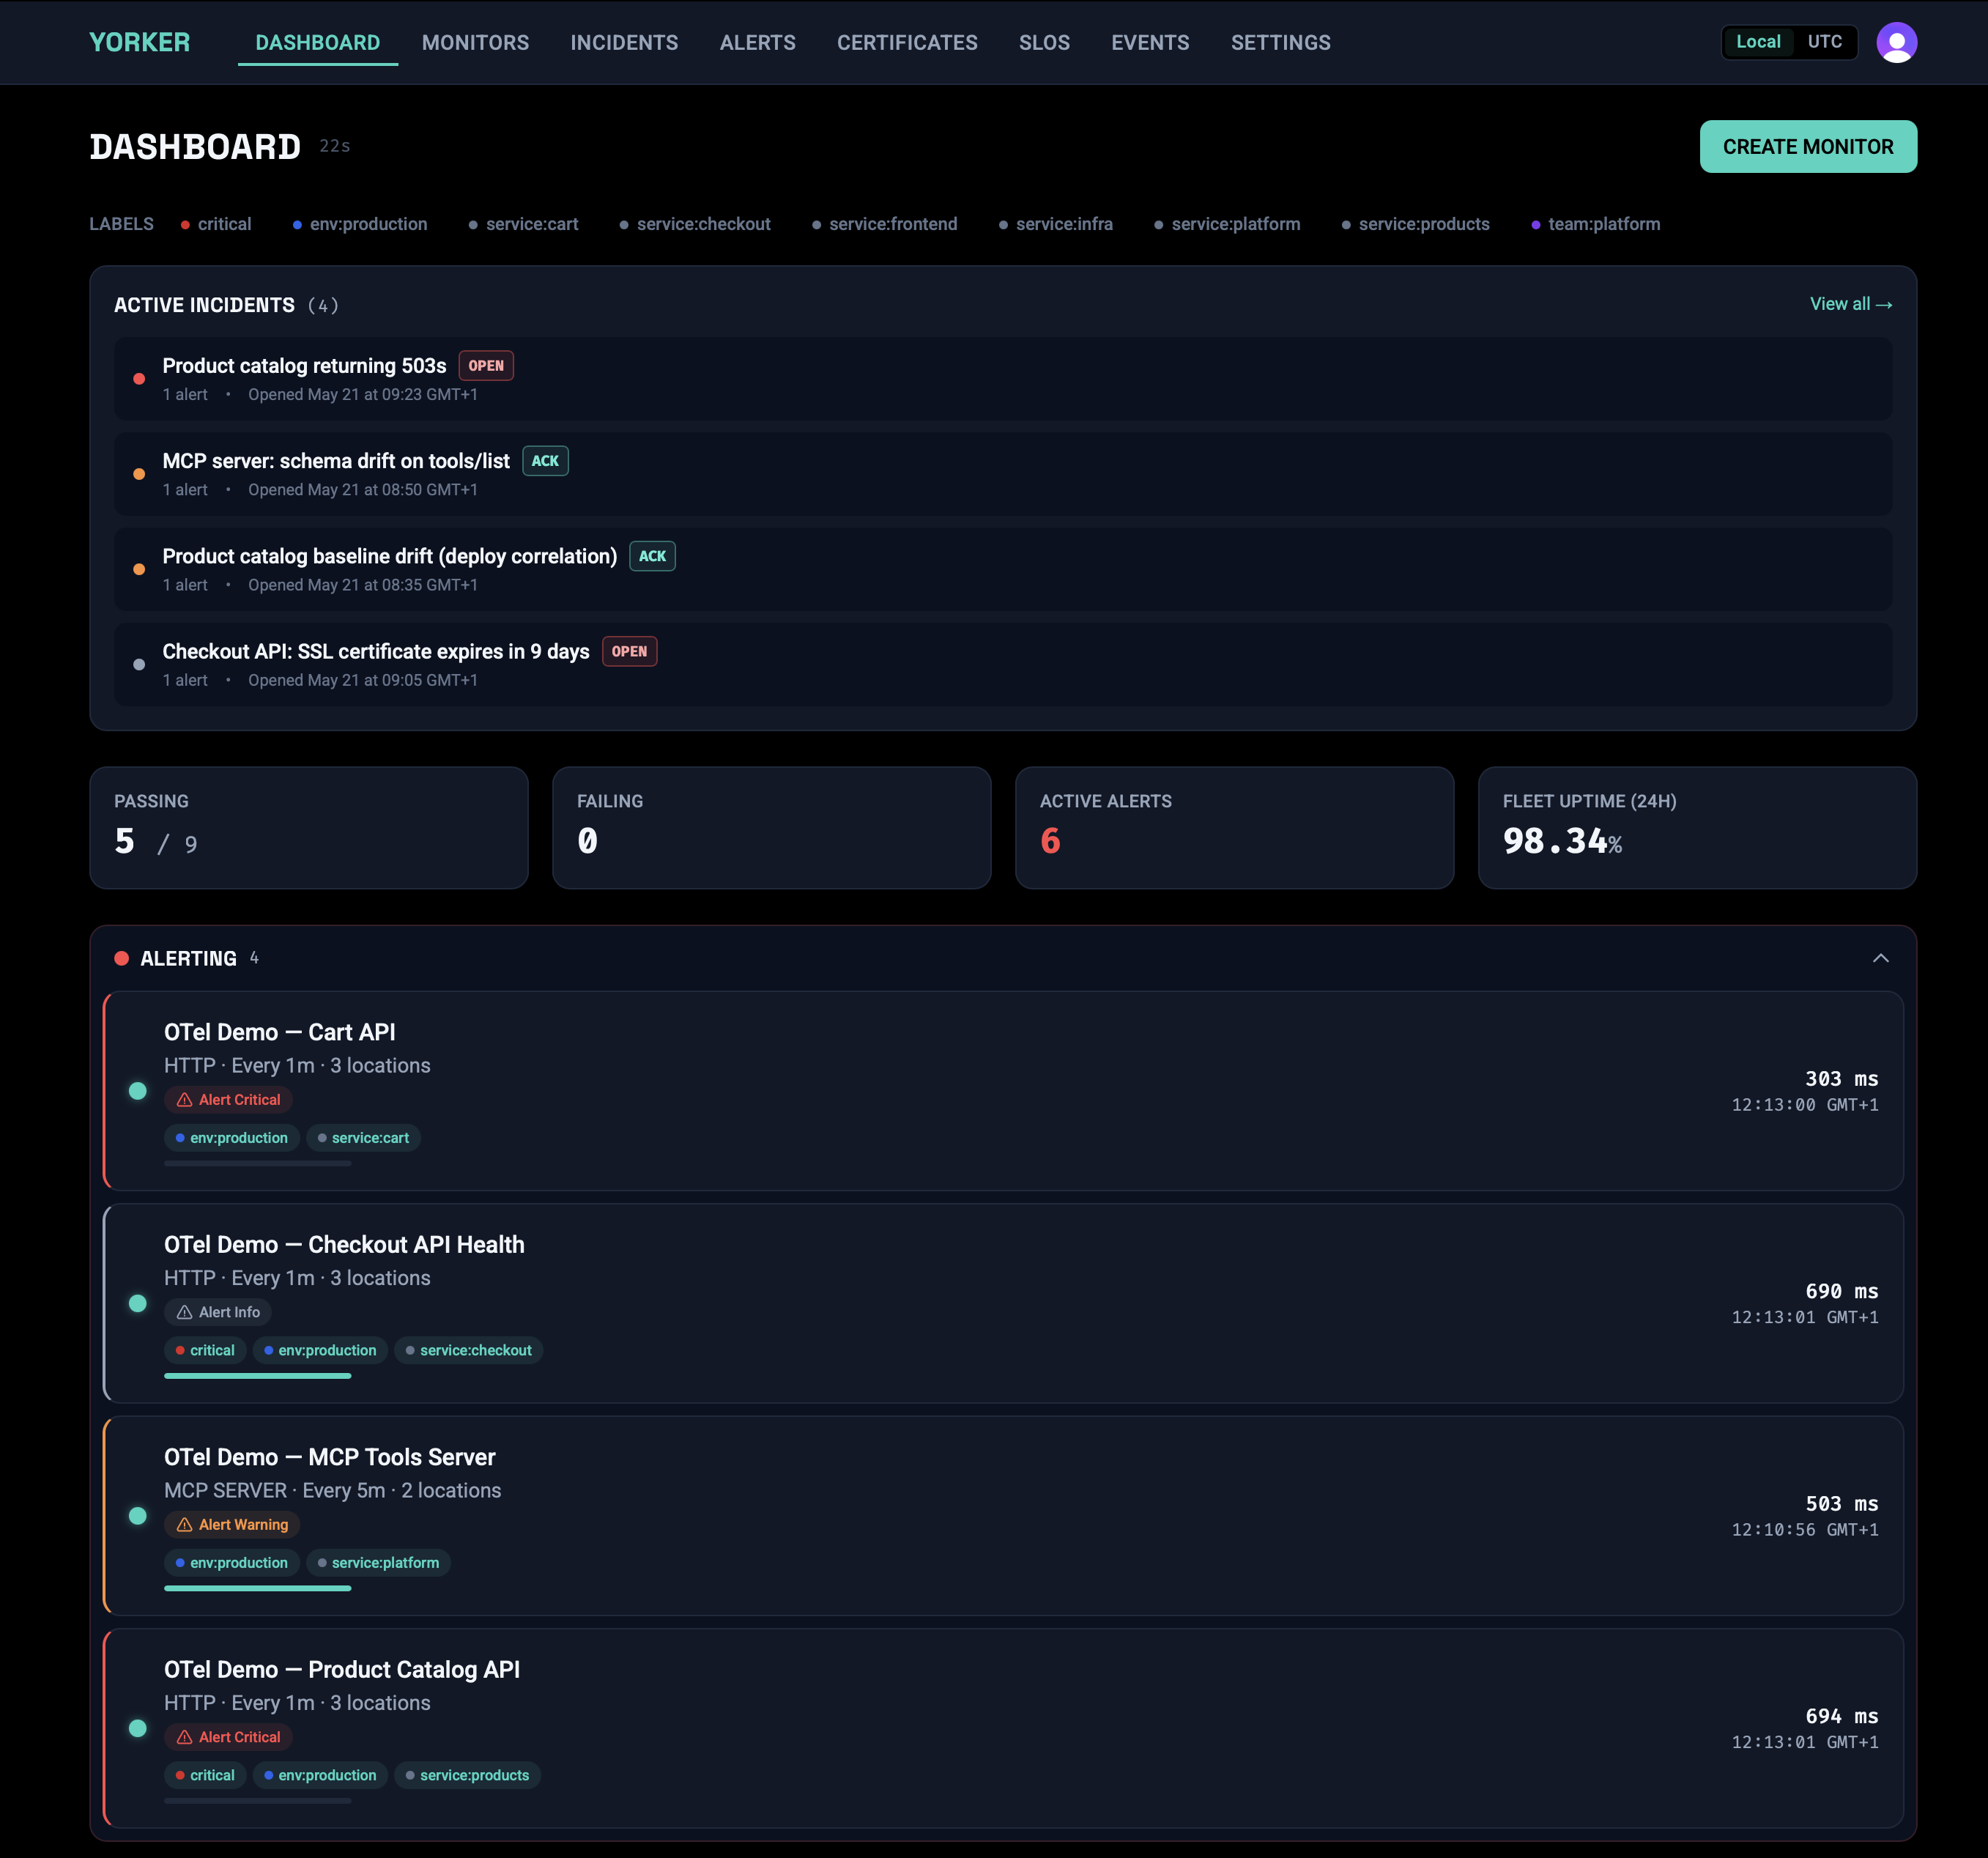
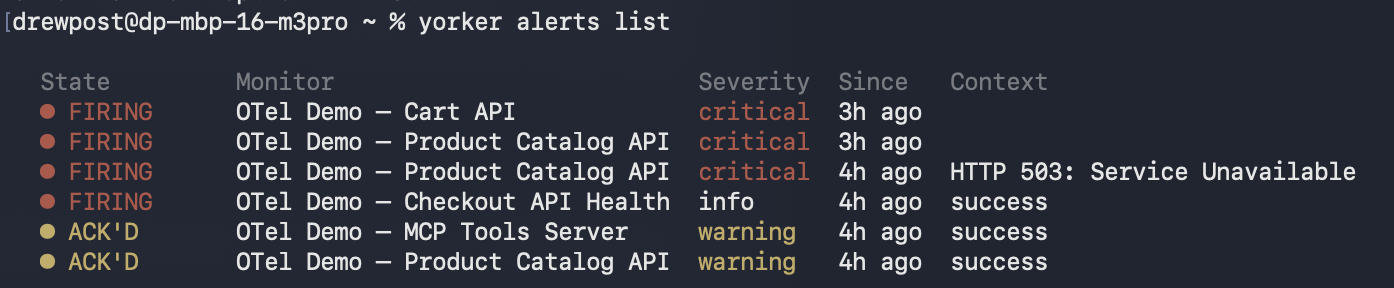
When something starts firing, you don't switch tabs to find out. yorker alerts list shows what is currently firing, since when, and the most recent context line from the failing check, so you can triage from the same terminal you are already debugging in.
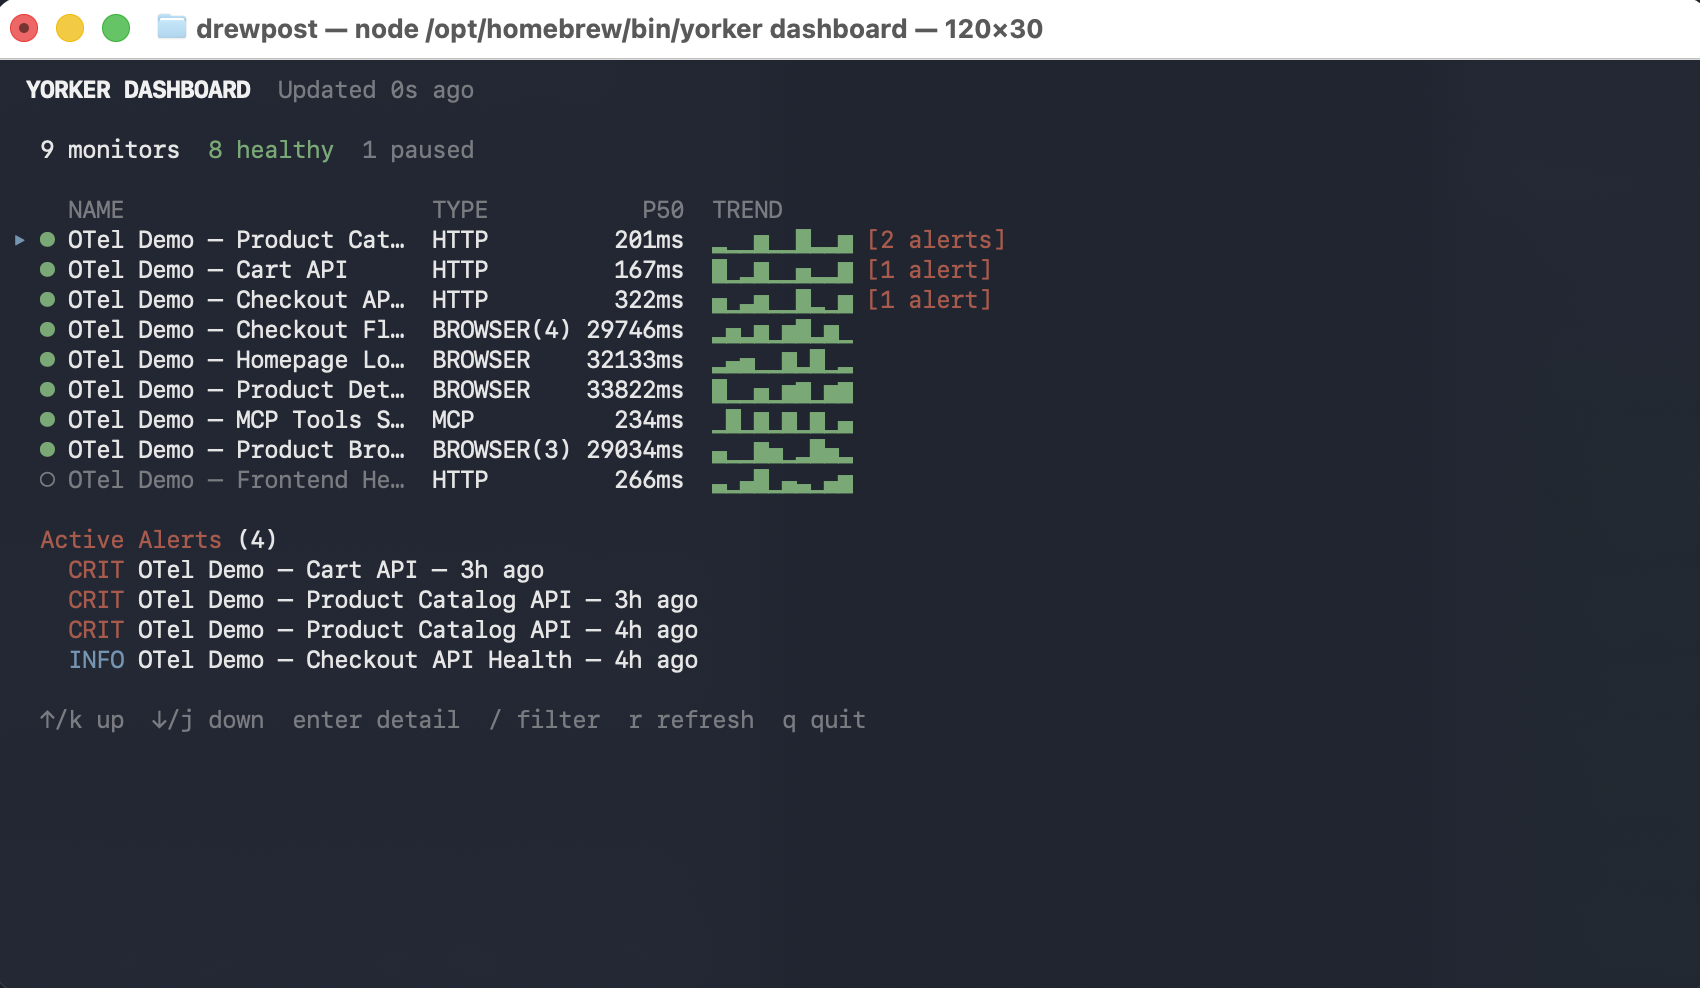
For a wider view, yorker dashboard is a full-screen TUI with the same health roll-up the web app shows: every monitor, current state, p50 response time, a sparkline trend, and any active alerts. Sortable, filterable, live-updating, without leaving the terminal.
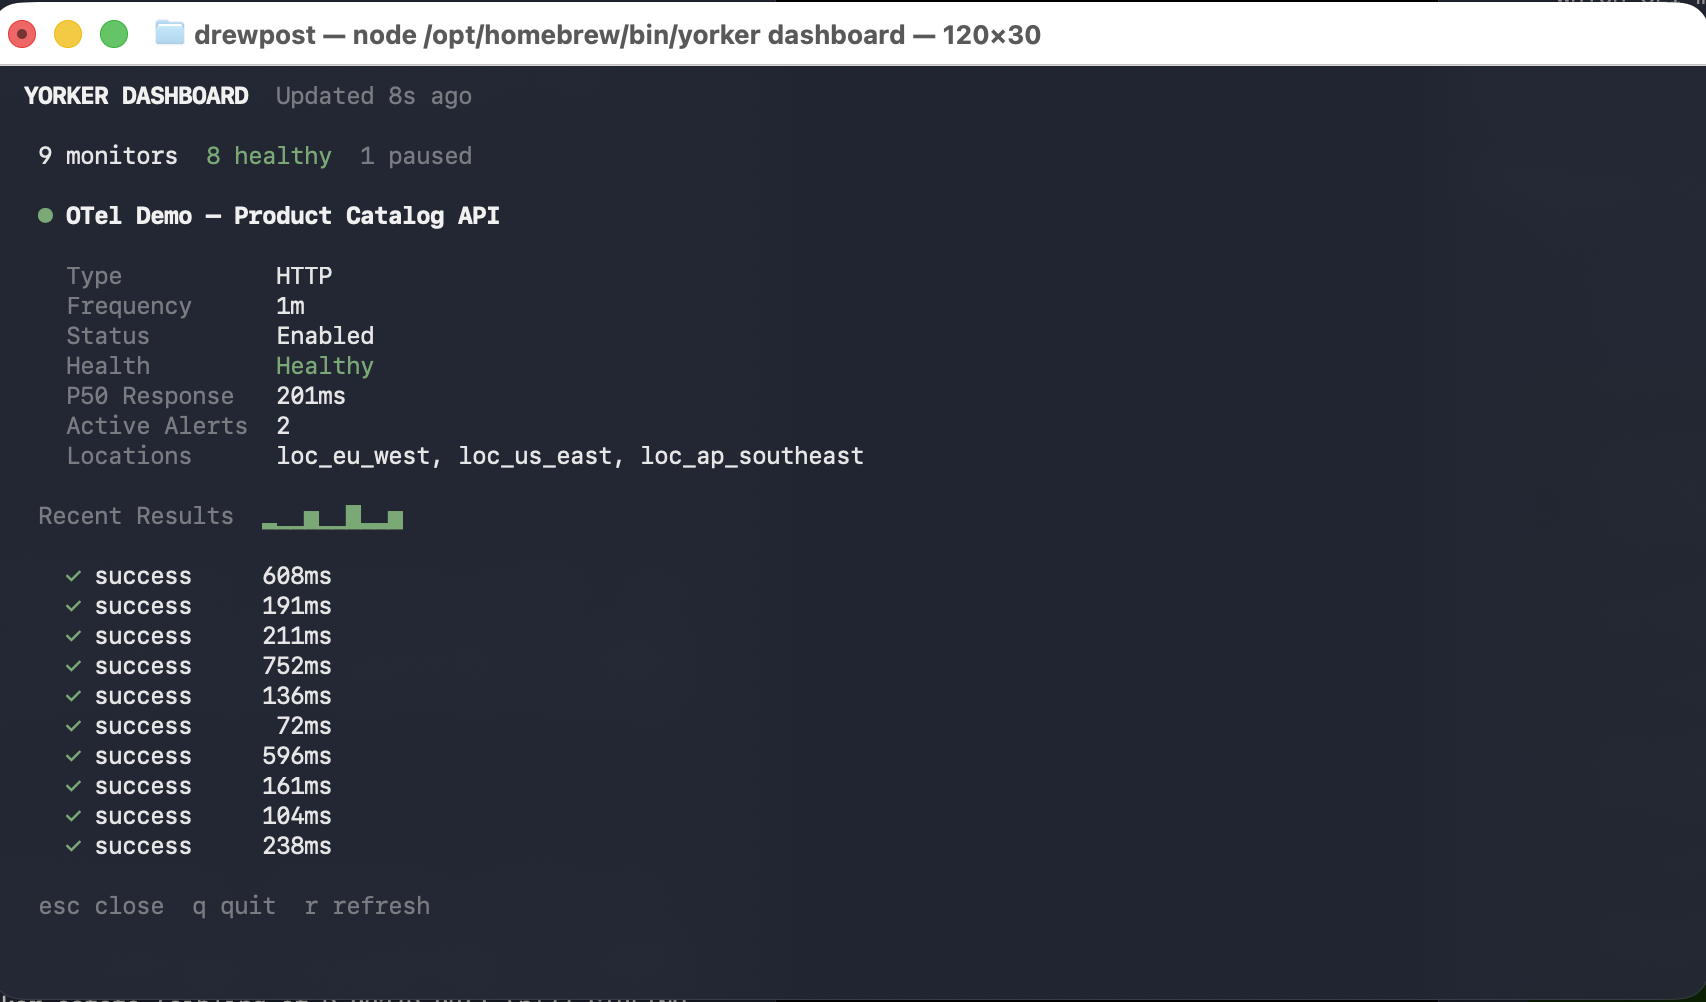
Drill into any row and you get the per-monitor detail: type, frequency, current health, p50, active locations, recent results with latency. The drilldown is the same primitive the web app exposes, rendered for a TTY because that is where you are debugging at 2am.
The CLI is not a thin shim. Every monitor type, alert rule, private location, and dashboard pack you can configure in the web app is configurable from yorker.config.yaml and deployable from CI. The web app is there when you want it; nothing in Yorker requires you to use it.
This is not a claim that the earlier eras were wrong. Each one answered its question well. The point is narrower and, we think, correct: the question moved to standard, portable, code-driven telemetry plus the analysis that makes that telemetry actionable, and the category mostly kept answering the platform-era question. That gap is the entire reason Yorker exists.
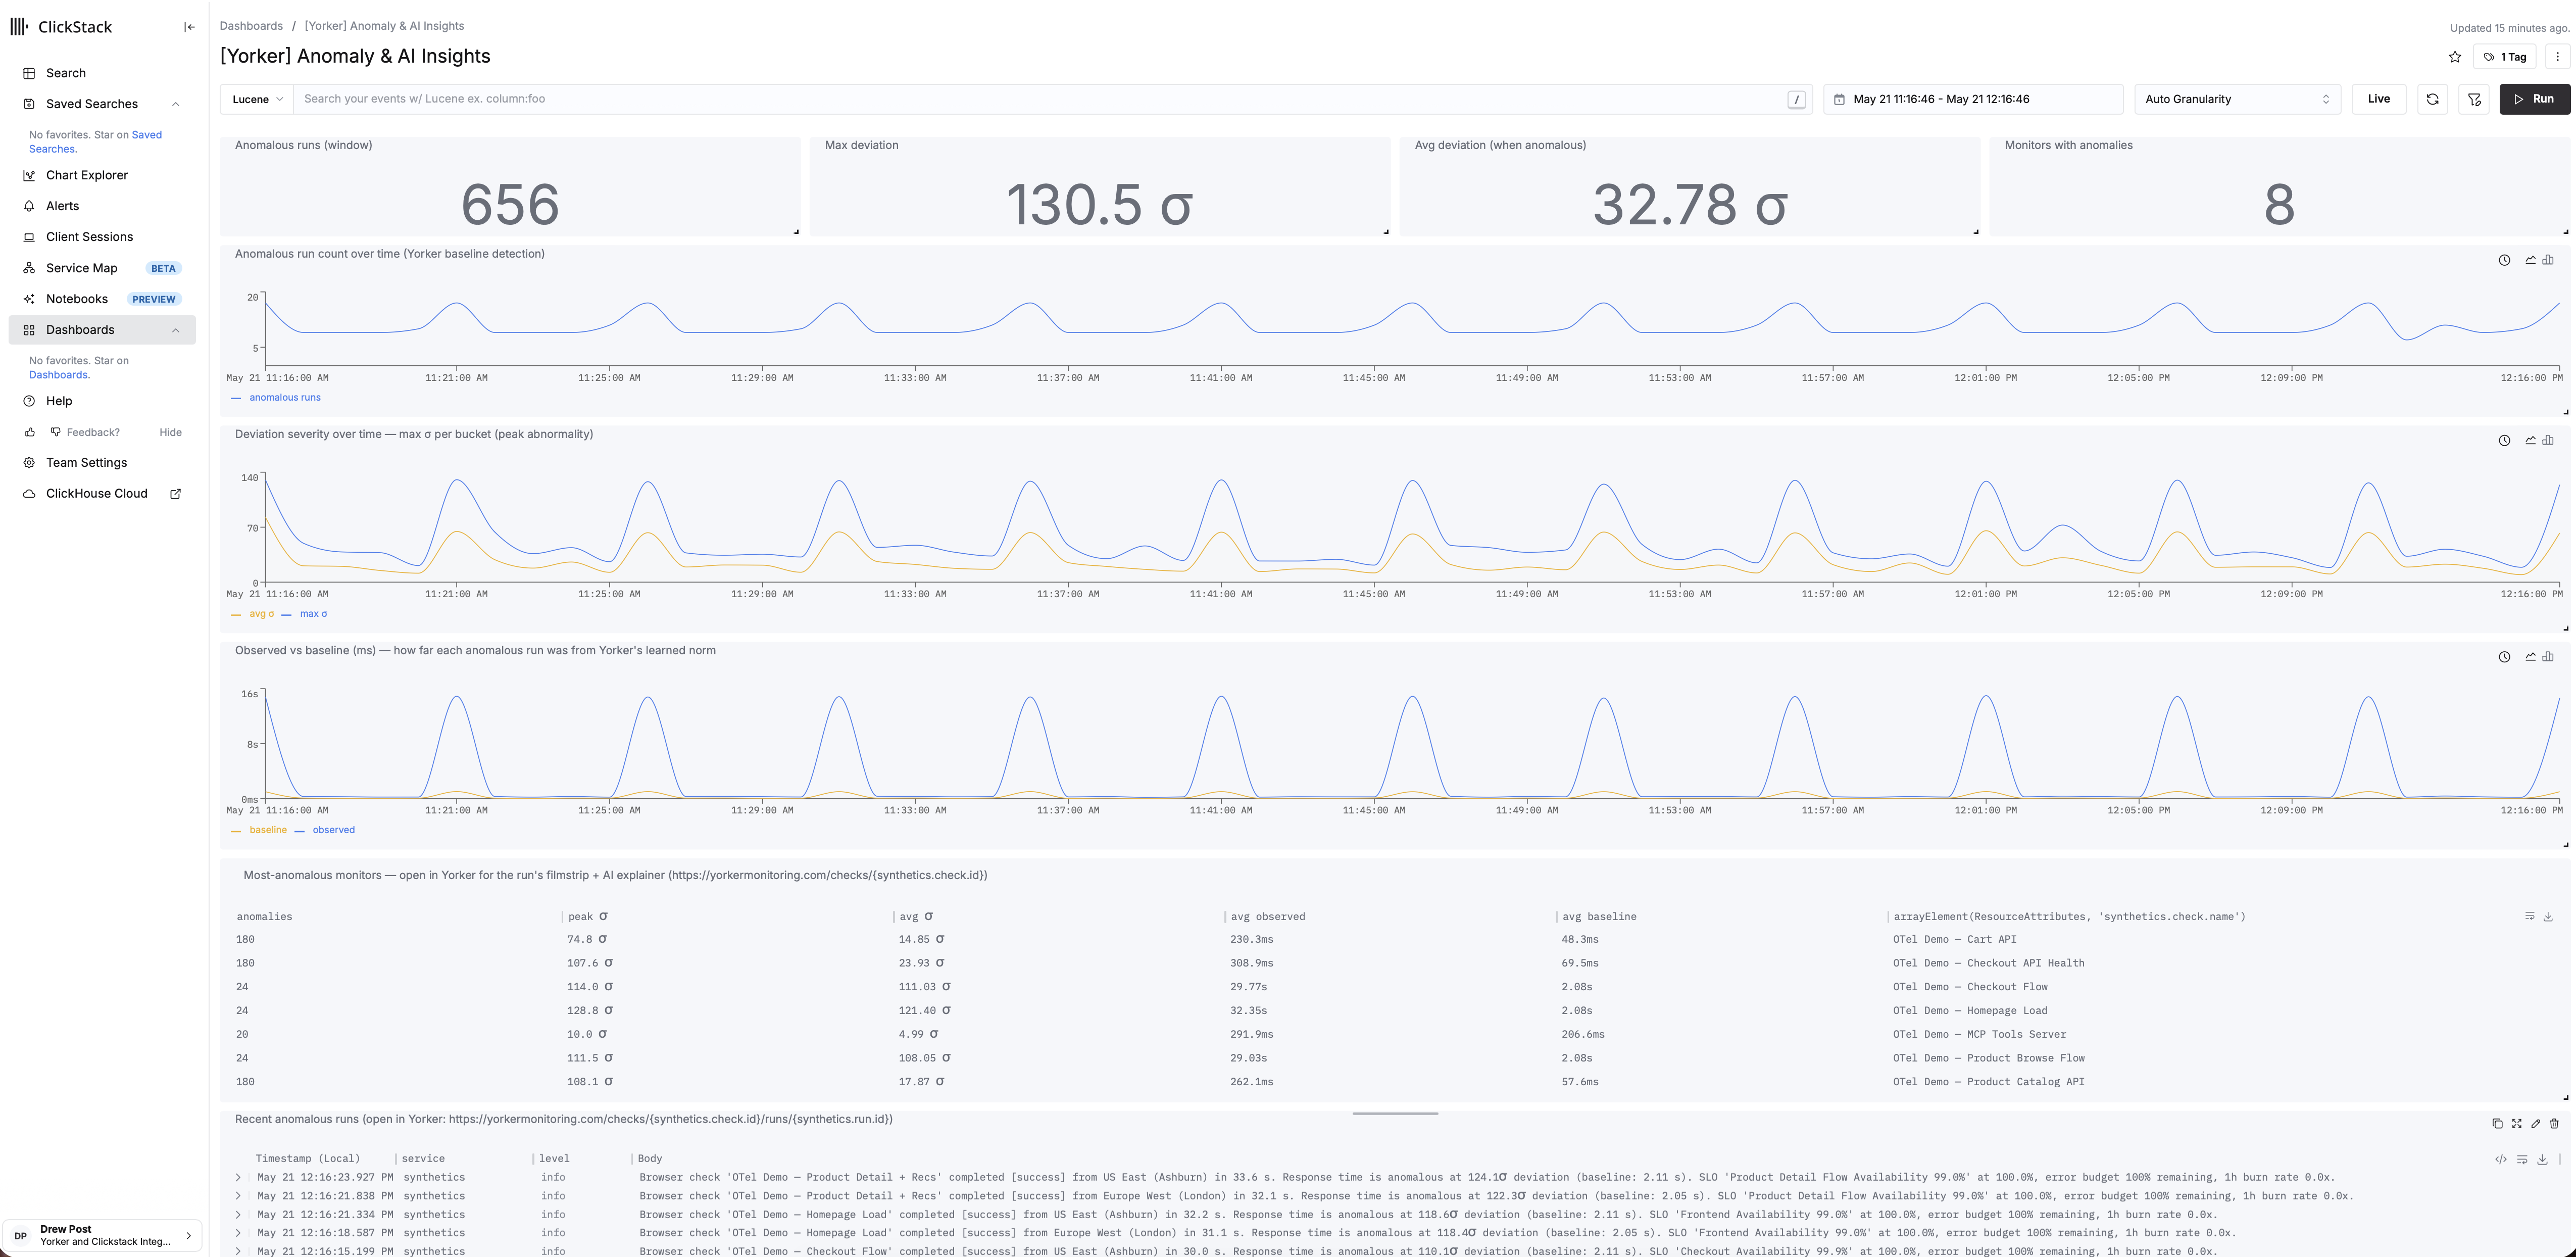
If your telemetry already speaks OTLP, the fastest way to judge the argument is to point Yorker at something you run and watch the analysed signal land in your own backend or your own agent.