The Missing Input to Your AI-SRE Tool
A new category of tool showed up in the last eighteen months. Call it agentic RCA, AI-SRE, causal incident analysis, whatever the vendor calls it. The shape is consistent: it ingests telemetry and change events from across your stack, builds a causal model of how your services depend on each other, and tells you what a deploy is likely to break or why an incident happened.
These tools are only as good as the signals they are fed. And one of the signals they should be reading is in the worst possible shape for them.
Synthetic monitoring was built for a human
For twenty years, synthetic monitoring had exactly one consumer: a person looking at a dashboard. Every product decision optimized for that. The output is a status page, a latency chart, an uptime percentage, an alert that fires when the number goes red.
That is the right output for a human triaging at 3am. It is the wrong input for a causal engine.
Think about what a causal model actually needs to draw an edge from a change to a symptom. It needs attribution: not "the checkout flow is slow" but "the checkout flow is slow because a third-party tag manager is taking nine seconds." It needs a join key: something that ties the synthetic observation to the backend trace, the deploy, the infrastructure change, so the engine can correlate instead of guess from timestamps. And it needs the signal to be a conclusion, not a pile of raw data it has to reduce itself inside a finite context window.
Take a typical synthetic check result and ask whether a machine downstream can use it. A green dot has no attribution. A latency number has no join key. A raw network waterfall has 187 entries and no conclusion. The engine either ignores it or burns its context budget reconstructing what the monitor already knew.
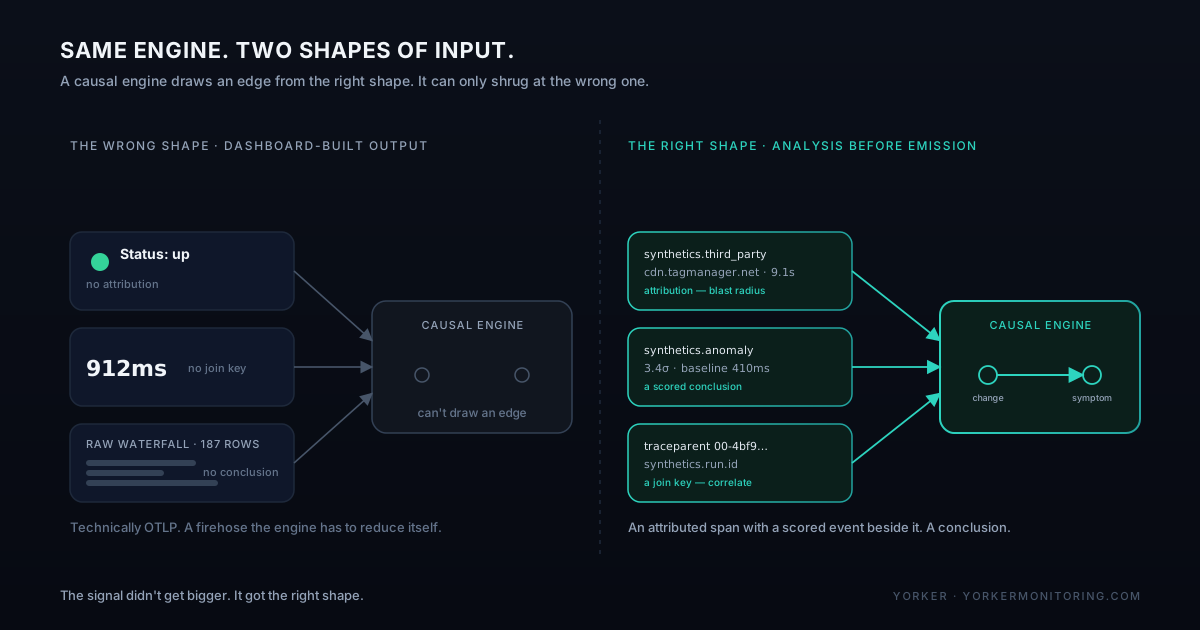
The output is the wrong shape
Here is the uncomfortable part. This is not a missing feature in one product. It is a category-wide assumption. Every synthetic monitoring tool was designed before the consumer changed, so every one of them emits dashboard-shaped output. Bolt an OpenTelemetry exporter onto that and you get a status code and a latency gauge with no attribution and no trace context. Technically OTLP. Practically useless to a causal engine.
The synthetics industry is still selling charts. The consumer reading those charts is no longer only a human.
What the right shape looks like
The fix is not a dashboard. It is changing what the monitor emits and when it does the work.
Do the analysis before the signal reaches the engine, not after it gets there. Classify the third-party requests onto the span. Score the successful runs against a real baseline, per metric, per location, per hour of day, so a slowdown that never trips a hard failure still arrives as a flagged anomaly on the completed event. Inject a W3C traceparent into the check's HTTP requests so that when your services continue the context, the synthetic run and the backend trace are the same trace. All of it standard OTLP, in the same backend the rest of your telemetry already lives in.
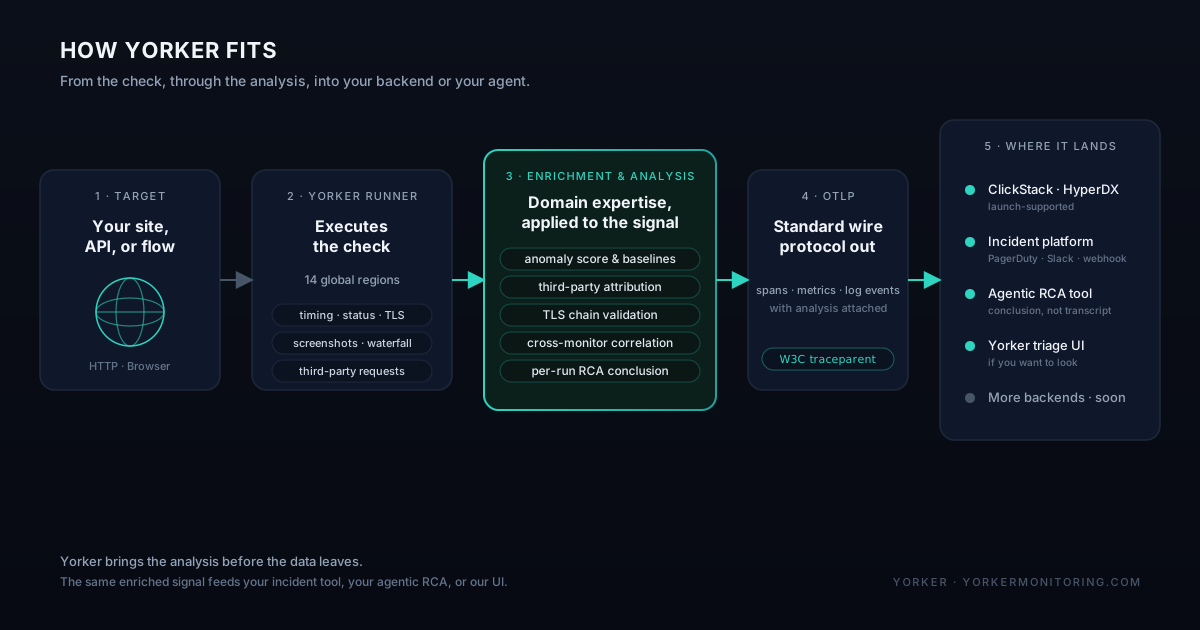
Now a causal engine reading your backend gets something it can use:
synthetics.third_party.domains,synthetics.third_party.count, andsynthetics.third_party.total_byteson the browser check span. The blast-radius answer is in the data, not in a manual investigation.synthetics.is_anomalous,synthetics.anomaly.deviation_sigma, andsynthetics.anomaly.baseline_valueon the completed and failed events when a run deviates from its baseline. A scored deviation for the silent slowdowns, with the baseline it deviated from sitting right next to it, not a raw number the engine has to baseline itself.synthetics.consecutive_failuresandsynthetics.suggested_next_stepsonsynthetics.check.failed. A flap and a sustained outage are distinguishable in the signal, which is exactly the distinction a causal model needs.- A
traceparentalready injected into the failing request. The join key is in the data. The engine correlates on trace ID instead of guessing.
An attributed span with anomaly-scored events beside it. A conclusion, not a firehose. The engine spends its context budget reasoning about cause instead of parsing noise to find the one request that mattered.
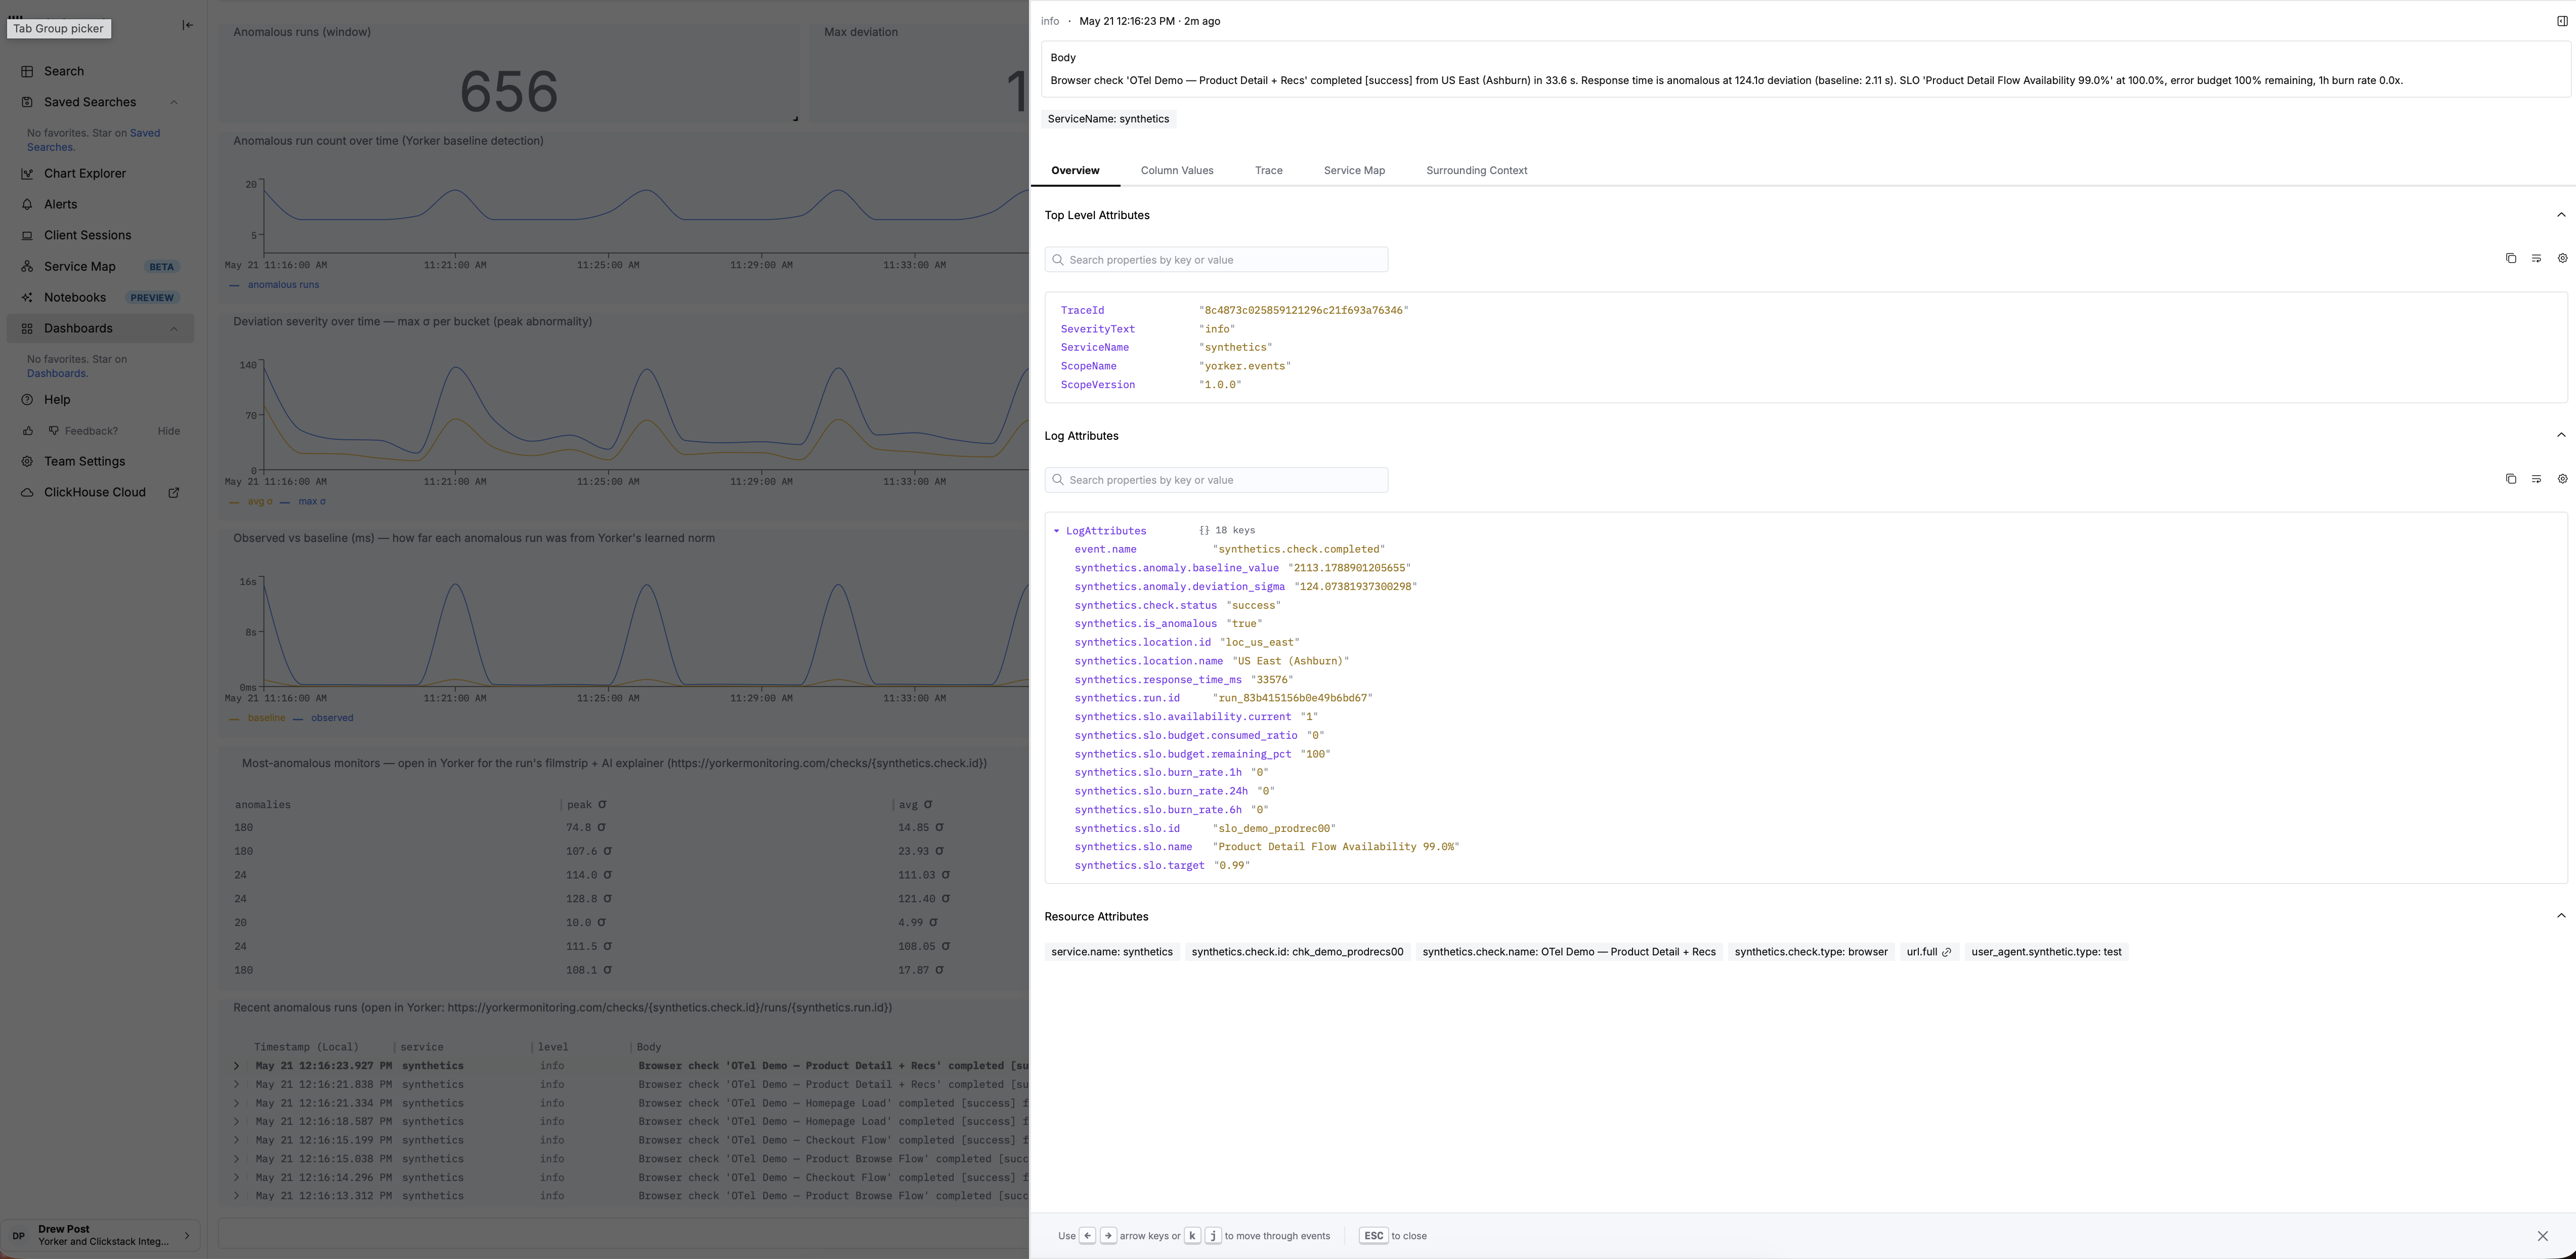
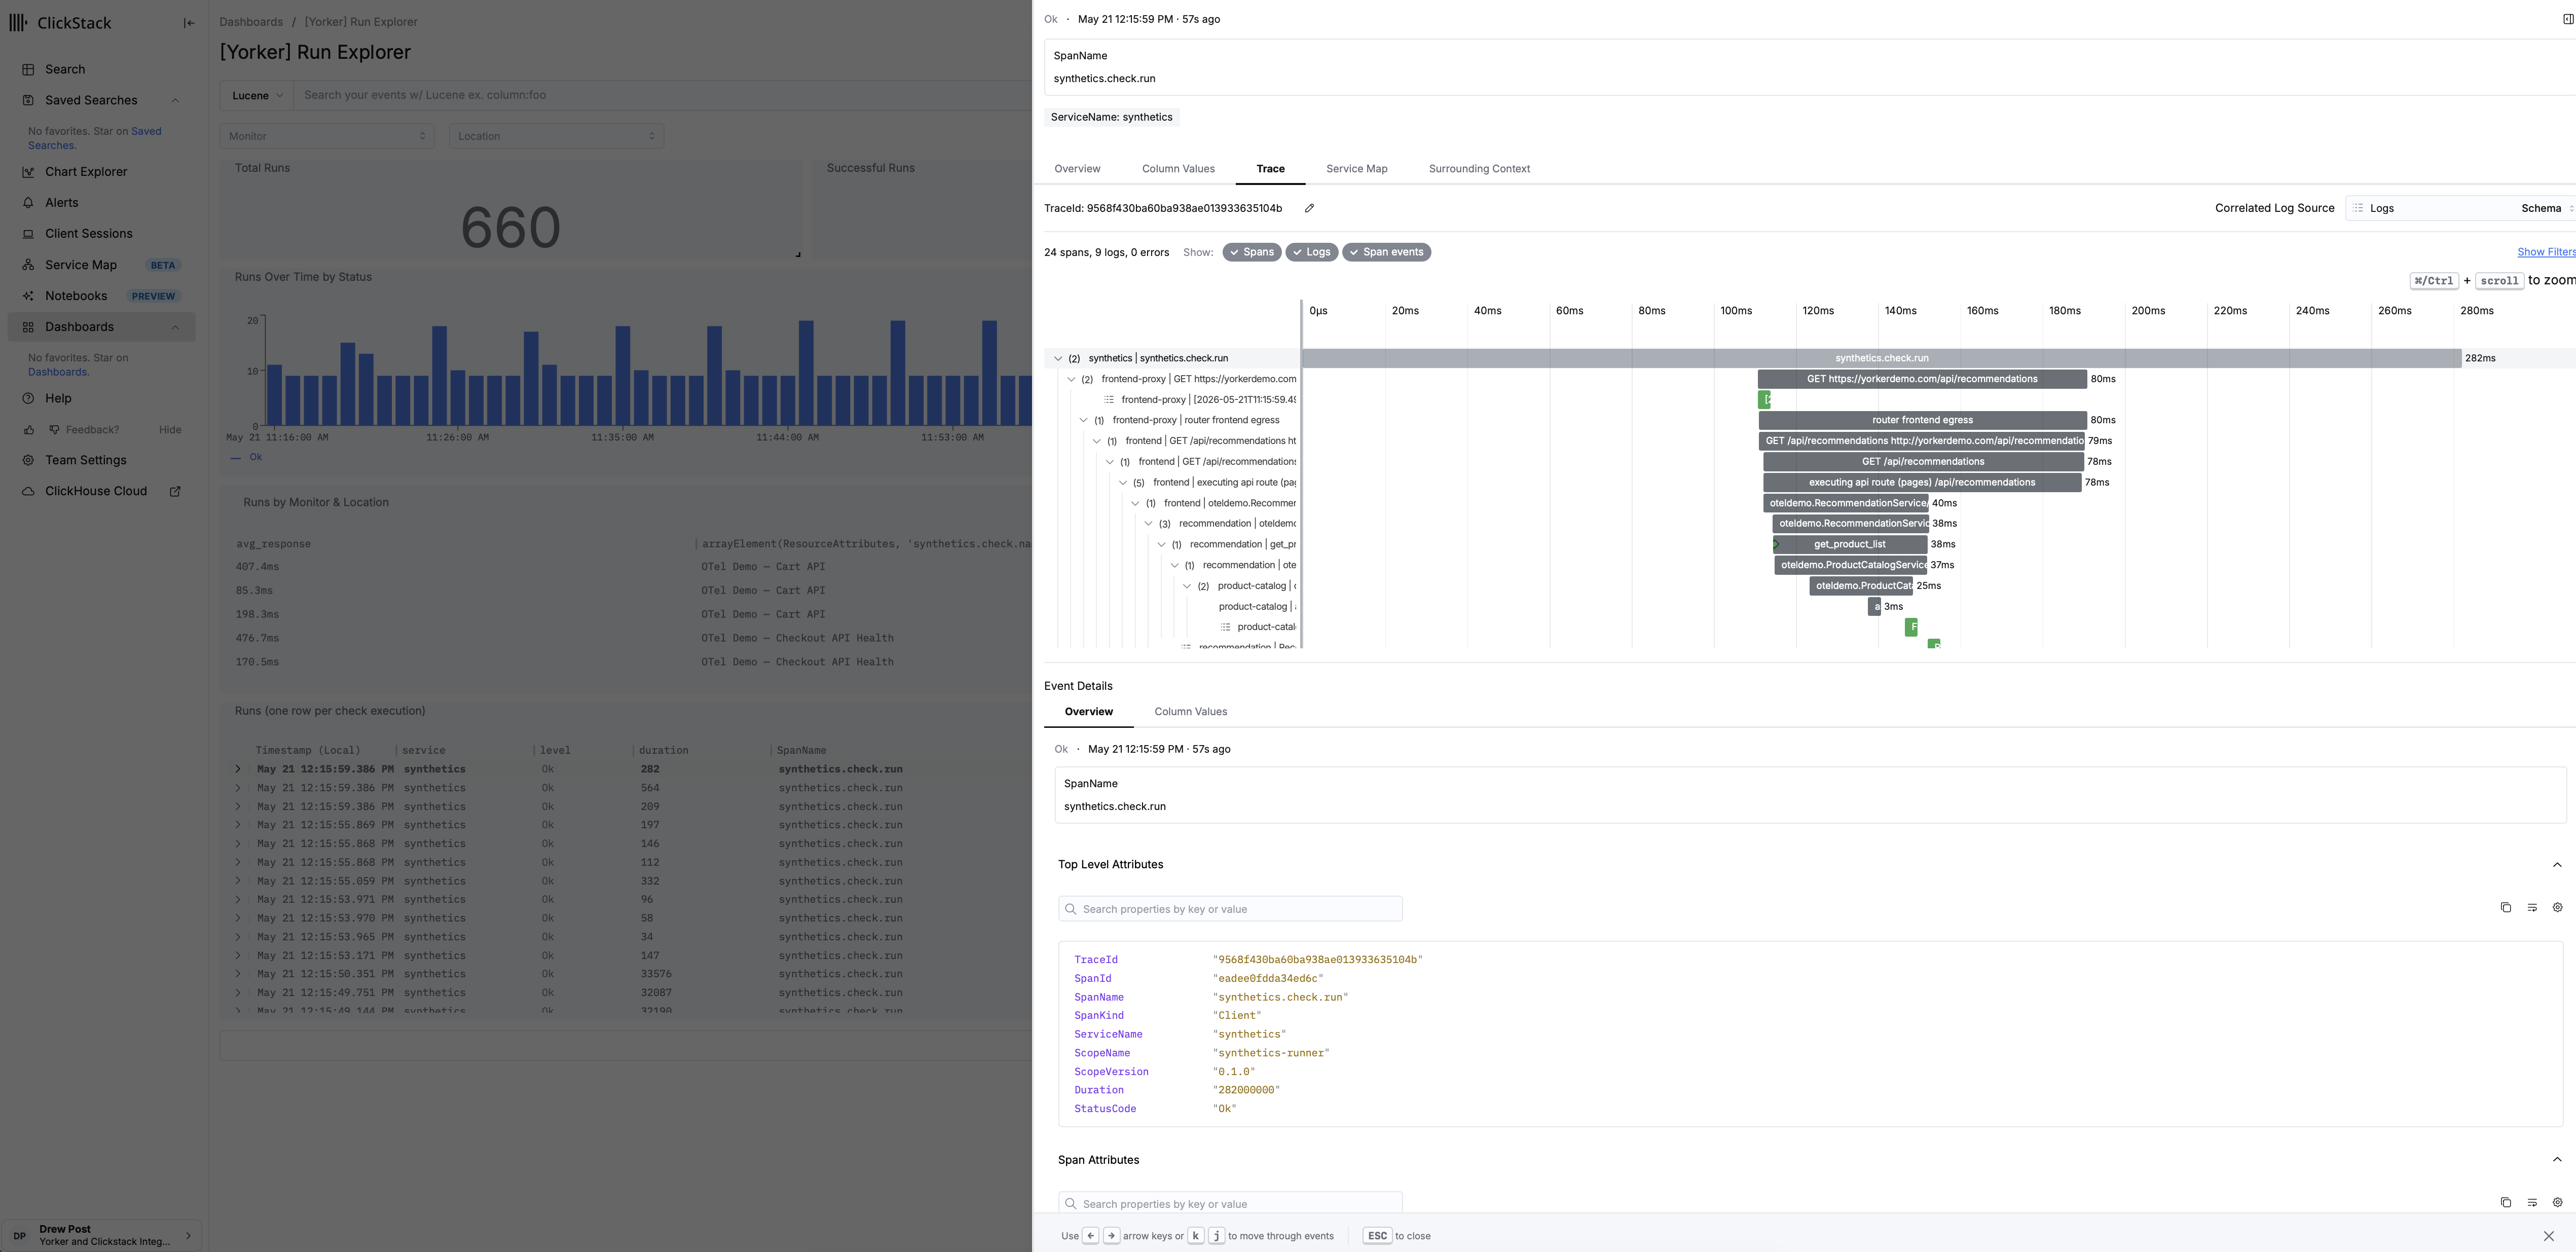
A note on honesty, because this is monitoring and the details matter. Span attributes like third-party attribution land in otel_traces, and third-party attribution is on browser checks specifically, because that is where the network-summary data comes from. Anomaly context (synthetics.is_anomalous, synthetics.anomaly.deviation_sigma, synthetics.anomaly.baseline_value) lands in otel_logs, attached to whichever event the run produces — synthetics.check.completed or synthetics.check.failed — whenever the run carries a baseline deviation. SLO context lands in otel_logs on both of those events too. A causal engine joins these on synthetics.run.id and trace ID. None of this requires an integration with the monitoring vendor. It is standard OTLP in your backend, which any AI-SRE tool that reads your observability data inherits for free.
This is the part nobody is building
We built Yorker this way on purpose. Not because OTLP-native is a checkbox, but because the consumer of synthetic data changed and the category did not notice. The front-end source of truth that feeds your causal engine should be deliberate, structured, and pre-correlated. Right now, for most teams, it is a green dot.
If you are running an AI-SRE or agentic RCA tool, look at what your synthetic monitoring is actually putting in front of it. A status code is not a source of truth.