The OTLP pipeline behind a check run

A check runs: a page loads, an HTTP request completes, or an MCP tool call returns. A moment later its telemetry is in your ClickHouse tables or your HyperDX dashboards. This post follows one run through the path in between: what the runner emits, how the check's trace joins your backend's trace, and the two routes the data takes to reach you.
OTLP without an SDK
The runner builds OTLP payloads itself and sends them over HTTP as JSON. There's no OpenTelemetry SDK in it.
That's a deliberate fit with how checks run. A browser check runs in a machine that exists for one run and is then destroyed, and even the long-lived runners handle each check as a short, self-contained piece of work. An SDK's batching processors, periodic metric readers and export timers are built for long-running services, where their setup cost is spread over hours of traffic. For a process that emits one run's telemetry and exits, they're overhead with nothing to amortise.
Writing the payloads directly keeps the runner small and fast to start, with fewer dependencies to audit, and it means the bytes that reach your backend are exactly the ones we chose to send.
What one run emits
Every signal from a run carries the same resource attributes, so traces, metrics and logs from one run join cleanly in your backend:
| Attribute | Example |
|---|---|
synthetics.check.id / .name / .type | chk_8f2a1c9b3d, API Health, http |
synthetics.location.id / .name / .type | loc_eu_west, London, UK, hosted |
synthetics.run.id | run_4a1c9e2f8b3d |
url.full | https://api.example.com/health |
service.name | synthetics |
user_agent.synthetic.type | test |
Each run produces:
- A trace with one root span,
synthetics.check.run, carrying the status, the response time, TLS certificate details for HTTPS targets, and screenshot links for browser checks. - Metrics for success and response time, plus DNS, connect, TLS and time-to-first-byte phases for HTTP checks, and LCP, FCP and CLS for browser checks.
- A log record holding the full result: timing, assertions, TLS and Web Vitals, linked to the trace by trace and span ID.
A trimmed trace payload for an HTTP check looks like this:
{
  "resourceSpans": [{
    "resource": { "attributes": [
      { "key": "synthetics.check.name", "value": { "stringValue": "API Health" } },
      { "key": "synthetics.location.name", "value": { "stringValue": "London, UK" } },
      { "key": "url.full", "value": { "stringValue": "https://api.example.com/health" } }
    ]},
    "scopeSpans": [{
      "spans": [{
        "traceId": "4bf92f3577b34da6a3ce929d0e0e4736",
        "spanId": "00f067aa0ba902b7",
        "name": "synthetics.check.run",
        "attributes": [
          { "key": "synthetics.check.status", "value": { "stringValue": "success" } },
          { "key": "synthetics.response_time_ms", "value": { "intValue": "142" } },
          { "key": "synthetics.tls.days_until_expiry", "value": { "intValue": "62" } }
        ]
      }]
    }]
  }]
}One trace, not two
Before a check runs, the runner creates a trace ID and a span ID and sends them as a W3C traceparent header on the check's own requests. For HTTP and MCP checks that's the request itself; for browser checks it's the page navigation and the requests the page makes. The check's own span uses the same trace ID.
When your services continue that trace context, the synthetic check and the backend spans it caused are one distributed trace. You can go from a slow check straight to the service call that made it slow, joined on the trace ID rather than lined up by timestamp.
Two paths to your backend
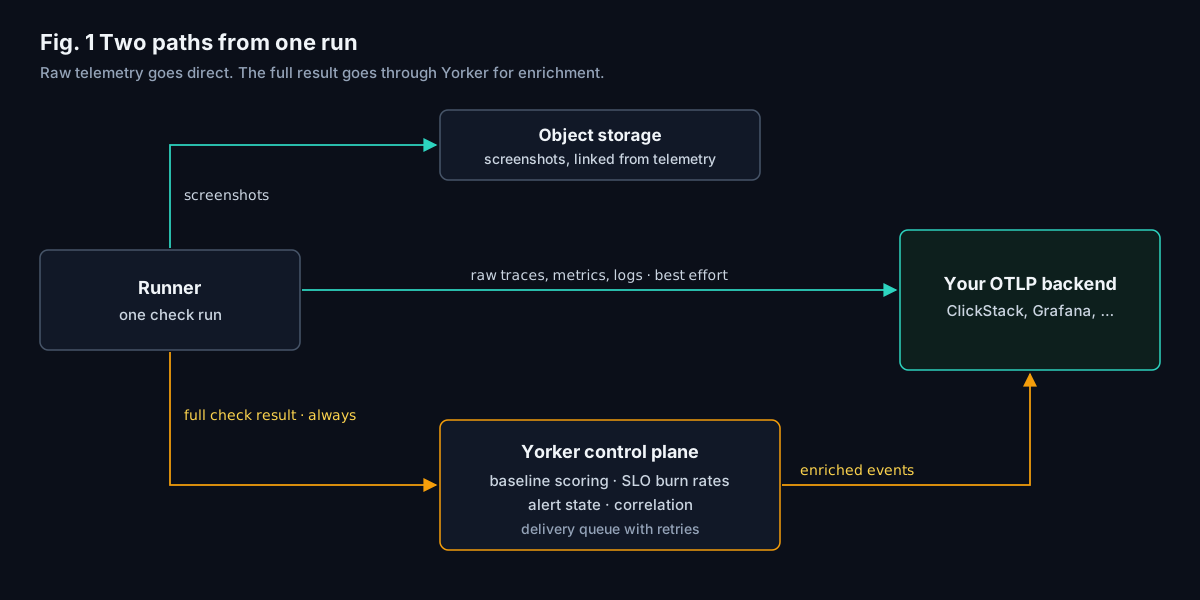
When a run finishes, its data takes two routes.
Direct. The runner sends its traces, metrics and logs straight to your OTLP endpoint. This path is fast and best effort. If your endpoint is unreachable, the failure is recorded on the result and the run carries on.
Through Yorker. The runner always sends the full check result to Yorker's control plane, whatever happened on the direct path. That's where the analysis a single run can't do for itself happens: scoring against the check's baseline, SLO burn rates, alert state, certificate change detection, and correlation across checks. The resulting events, such as synthetics.check.completed and synthetics.check.failed with their anomaly and SLO attributes, go into a delivery queue and are sent to the same OTLP endpoint, with retries if your backend is briefly unavailable.
The direct path gets the raw run into your backend quickly. The Yorker path adds the conclusions that need history and context from across your account.
Screenshots
Screenshots don't travel through OTLP. Browser checks upload them to object storage, and the telemetry carries links: the first frame, the total count, and the filmstrip, capped so a long run can't exceed a backend's attribute size limits.
Private locations
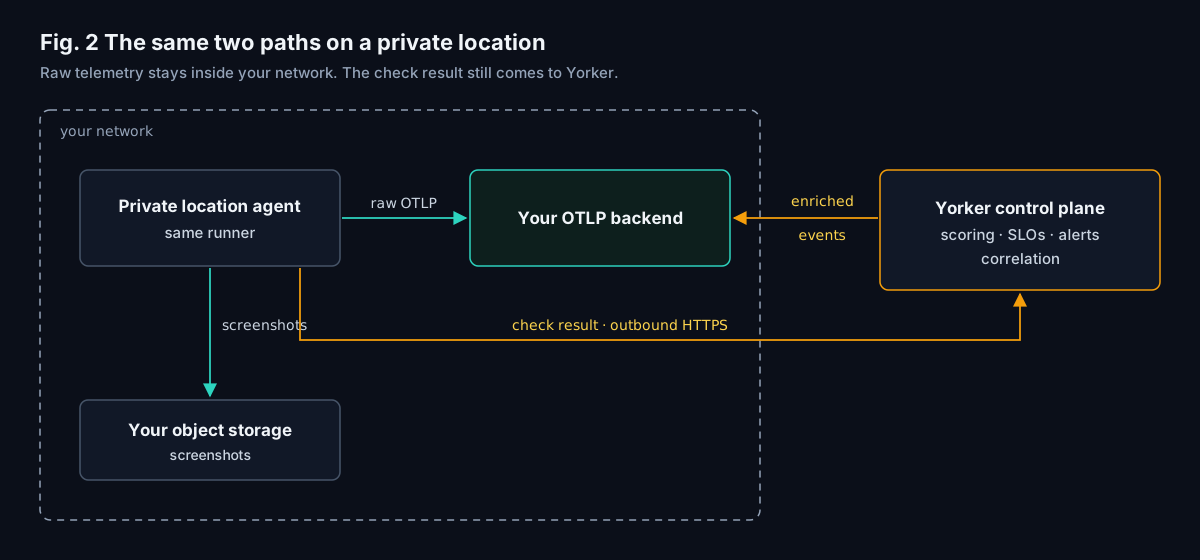
A private location runs the same runner on your infrastructure. The direct path starts inside your network, so raw traces, metrics and logs go from the agent to your OTLP endpoint without passing through Yorker. The check result still comes back to Yorker over the agent's outbound HTTPS connection, because scoring, SLOs and alerting run there, and the enriched events are then delivered to your backend as usual.
Every name in this post is a standard OTLP attribute or event in your own backend, readable by whatever already reads your telemetry.