Your coding agent doesn't care about LCP

Ask a coding agent to add a feature and it will add the feature. It renders the component, wires up the state, makes the button do what you asked, and stops, because stopping is what the prompt implied. No step in that loop asks whether the page still loads fast on a mid-range Android phone on patchy 4G in a country you've never shipped to. The agent optimises for "it renders and the tests pass," and Largest Contentful Paint was never part of that contract.
I've written before about what changes when agents write the code that ships to production. Performance is the sharpest version of that problem I keep running into. Plenty of AI-generated code is fine; my complaint is with what the feedback loop measures. A build succeeds or it doesn't. A test passes or it doesn't. Performance sits outside that binary, so a system that stops as soon as the binary says yes never sees it.
The fastest network your code will ever run on
Coding agents, like most engineers, write code on a fast machine with a fast connection: a dev laptop with a warm cache, or a sandboxed CI container with a fibre uplink a few hops from the origin. The agent loads the page, sees it render in a few hundred milliseconds, and calls it done. The agent's judgement is fine. The environment it judges from is the problem, because the dev machine and the sandbox are structurally the fastest places the code will ever run. Every real user sits somewhere worse: an older phone, saturated wifi, a cell connection that drops to 3G at the edge of a building.
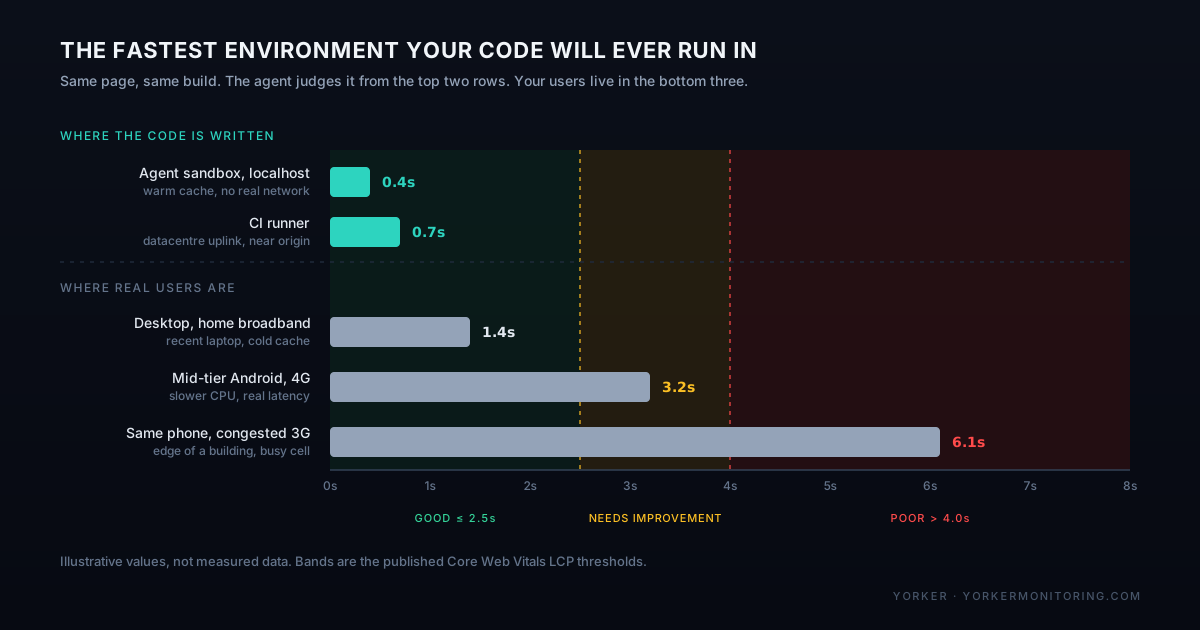
A human engineer picks this up eventually, usually because someone on the team has a slow phone and complains. An agent has no phone in its pocket, and nothing in its environment is ever slow enough to notice.
The patterns I keep seeing in agent-written frontends
None of these are exotic. They're the boring, repeatable failure modes of code that was optimised for "it works" and never asked to justify its weight:
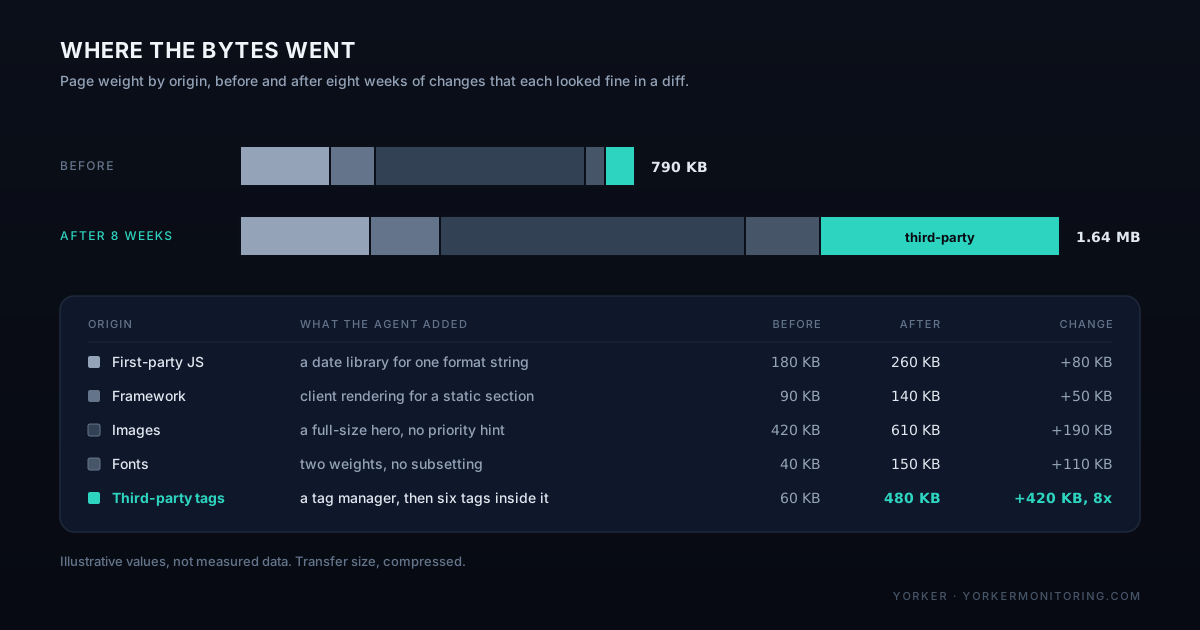
- Pulling in a whole library for one function. A date formatter needs one format string and gets a 40KB library. A debounce needs six lines and gets a utility package with its own dependency tree. The familiar, well-documented import was the shortest path to a working answer.
- Client-rendering what could be static. A marketing section, a pricing table, a docs page: none of it needs a
useEffectfetch on mount and a loading spinner. But"use client"plus a data fetch is a pattern the model has seen ten thousand times, and a static export is one it has to be told to reach for. - Unsized images and late-injected content. An
<img>withoutwidth/heightor a CSS aspect ratio reserves no space, so the layout jumps when the image loads. A banner injected by a script after the initial paint pushes everything below it down a beat later. Individually these are rounding errors. Stacked across a page they're the layout shift a real user feels. - Hero images with no priority signal. The largest image on the page loads with the same default priority as an icon in the footer, so the browser has no reason to fetch it first.
- Fonts with no display strategy. No
font-displayvalue and no preconnect to the font host, so the browser blocks text rendering until the font arrives. The agent added a nice-looking typeface and no fallback for the networks where "nice-looking" means "invisible for two seconds." - Stacking third-party scripts because the prompt asked for tracking. "Add analytics" turns into a tag manager, which turns into six more tags loaded through the tag manager, none of which the agent weighed because weight was never part of the ask.
- Waterfalls of sequential fetches. Three API calls that could run in parallel get written as three sequential
awaits because that's the order they appear in the prompt.
Each of these looks reasonable in a diff and is invisible in a fast sandbox, and each costs a real user anywhere from milliseconds to seconds on a page that used to be faster.
Nothing fails, the chart just tilts
This is what makes it dangerous rather than merely annoying. A broken API call throws an error and a failed assertion turns a CI run red. A performance regression does neither. The page still renders, the button still works, and the tests that check "does the checkout flow complete" still pass, because they never asserted on how long anything took. The deploy goes green, and the only artefact is a slightly worse LCP number that nobody is watching, followed some days later by a slightly worse conversion number that everybody eventually notices and nobody can immediately explain.
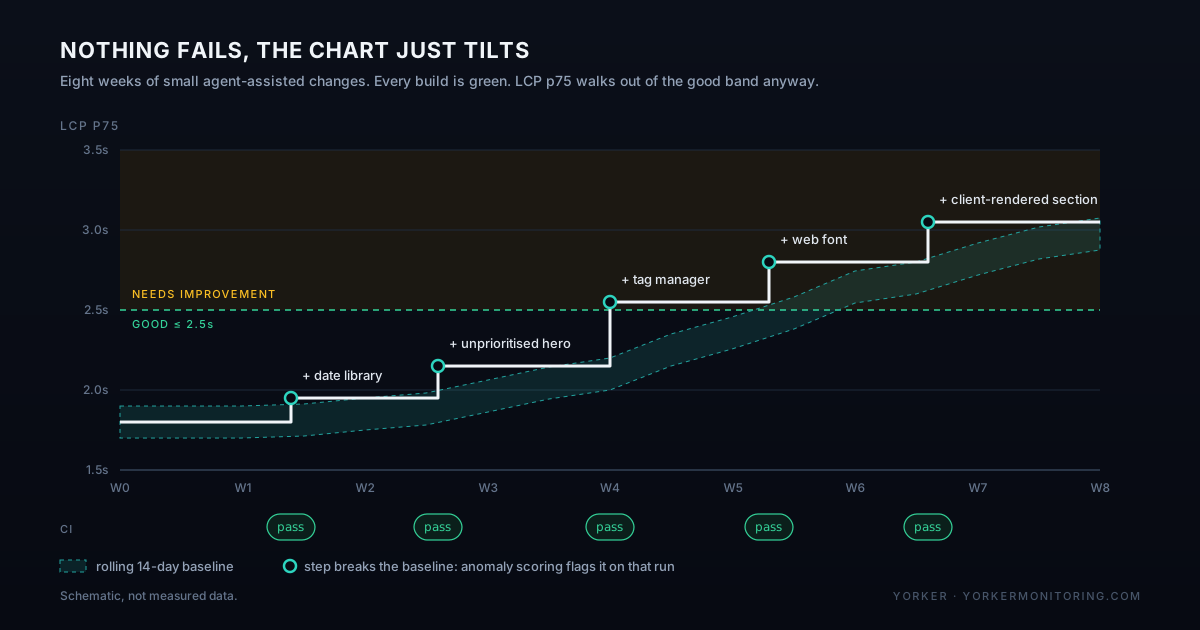
Performance debt compounds the way technical debt does, only more quietly. Ten small regressions across ten agent-assisted pull requests don't each trigger an incident. Each one shaves a bit off the top of the funnel, and by the time someone runs Lighthouse again the page has drifted so far that nobody remembers which change did it.
Lab data lies by omission
The standard answer to "is my page fast" is to run Lighthouse before you ship. That habit is worth keeping, but it answers a narrower question than it appears to: was this page fast, once, in this lab, on this run. It says nothing about next Tuesday, or about the region your traffic actually comes from, or about the third-party script that started failing to load its own dependency last week and is now blocking your page with no code change on your side.
A one-off score is a snapshot. Agent-introduced regressions are gradual and code-driven, so they show up between snapshots, in commits nobody thought to re-run Lighthouse against. The fix is to turn the snapshot into a continuous measurement: real browsers in real regions on a schedule, compared against a baseline instead of a fixed pass/fail bar that goes stale the moment your app changes shape.
I should be honest about the limits of lab data, because overselling it would be the same mistake I'm describing. Synthetic checks running scripted Playwright sessions are lab data. They tell you what a controlled browser experiences from a specific point on the map, on a schedule you control. They can't tell you what INP looks like, because Interaction to Next Paint measures how a real person's device responds to a real person's tap or keystroke, and only real-user monitoring captures that. The two are complementary. Lab data catches the regression before your first user does and tells you where on the page it came from; RUM tells you what your actual traffic experienced. With only one of them you're missing half the picture.
Write the budget into the check, not the code review
A performance budget that lives in a wiki page or a six-month-old Slack message gets forgotten. A budget that lives in a script running on every deploy gets enforced whether anyone remembers it or not. Below is that budget as a Playwright script. It captures LCP and CLS the way any real-user-monitoring library does, with the browser's own PerformanceObserver API, then fails the check when the budget is breached. Nothing here is a Yorker-specific assertion type; it's plain Playwright you could run in any Playwright-based check.
// @step: Load the page and capture Web Vitals
await page.goto("https://shop.example.com/product/1234");

const vitals = await page.evaluate(() => {
  return new Promise<{ lcp: number; cls: number }>((resolve) => {
    let lcp = 0;
    let cls = 0;

    new PerformanceObserver((list) => {
      const entries = list.getEntries();
      const last = entries[entries.length - 1];
      if (last) lcp = last.startTime;
    }).observe({ type: "largest-contentful-paint", buffered: true });

    // LayoutShift isn't in lib.dom.d.ts, so `entry` needs a cast to read
    // `hadRecentInput` and `value`. Ignore shifts that follow user input,
    // same convention the Web Vitals spec itself uses.
    new PerformanceObserver((list) => {
      for (const entry of list.getEntries() as Array<PerformanceEntry & { hadRecentInput: boolean; value: number }>) {
        if (!entry.hadRecentInput) cls += entry.value;
      }
    }).observe({ type: "layout-shift", buffered: true });

    // Give LCP and any late layout shifts time to settle after load.
    setTimeout(() => resolve({ lcp, cls }), 3000);
  });
});

// @step: Assert the performance budget
const LCP_BUDGET_MS = 2500; // web.dev "good" threshold
const CLS_BUDGET = 0.1; // web.dev "good" threshold

if (vitals.lcp > LCP_BUDGET_MS) {
  throw new Error(`LCP budget breached: ${Math.round(vitals.lcp)}ms > ${LCP_BUDGET_MS}ms`);
}
if (vitals.cls > CLS_BUDGET) {
  throw new Error(`CLS budget breached: ${vitals.cls.toFixed(3)} > ${CLS_BUDGET}`);
}The throw is the point. A budget that only produces a number in a report is one nobody acts on. A budget that fails a check behaves like every other assertion you already trust: green means the constraint held, red means it didn't.
Prompt the budget, then verify it
If you already give an agent acceptance criteria (the flow should work, the tests should pass, the types should check), add a line with the performance budget: "LCP under 2.5s, CLS under 0.1, no new script added without checking its transfer size." A prompt won't enforce anything, since agents drop constraints from context over a long session the way anyone does, but a stated budget beats an implicit one. Then verify it the way you'd verify any other claim an agent makes about its own code: with a check that runs independently of the agent and doesn't care what the diff says it did.
Where Yorker fits
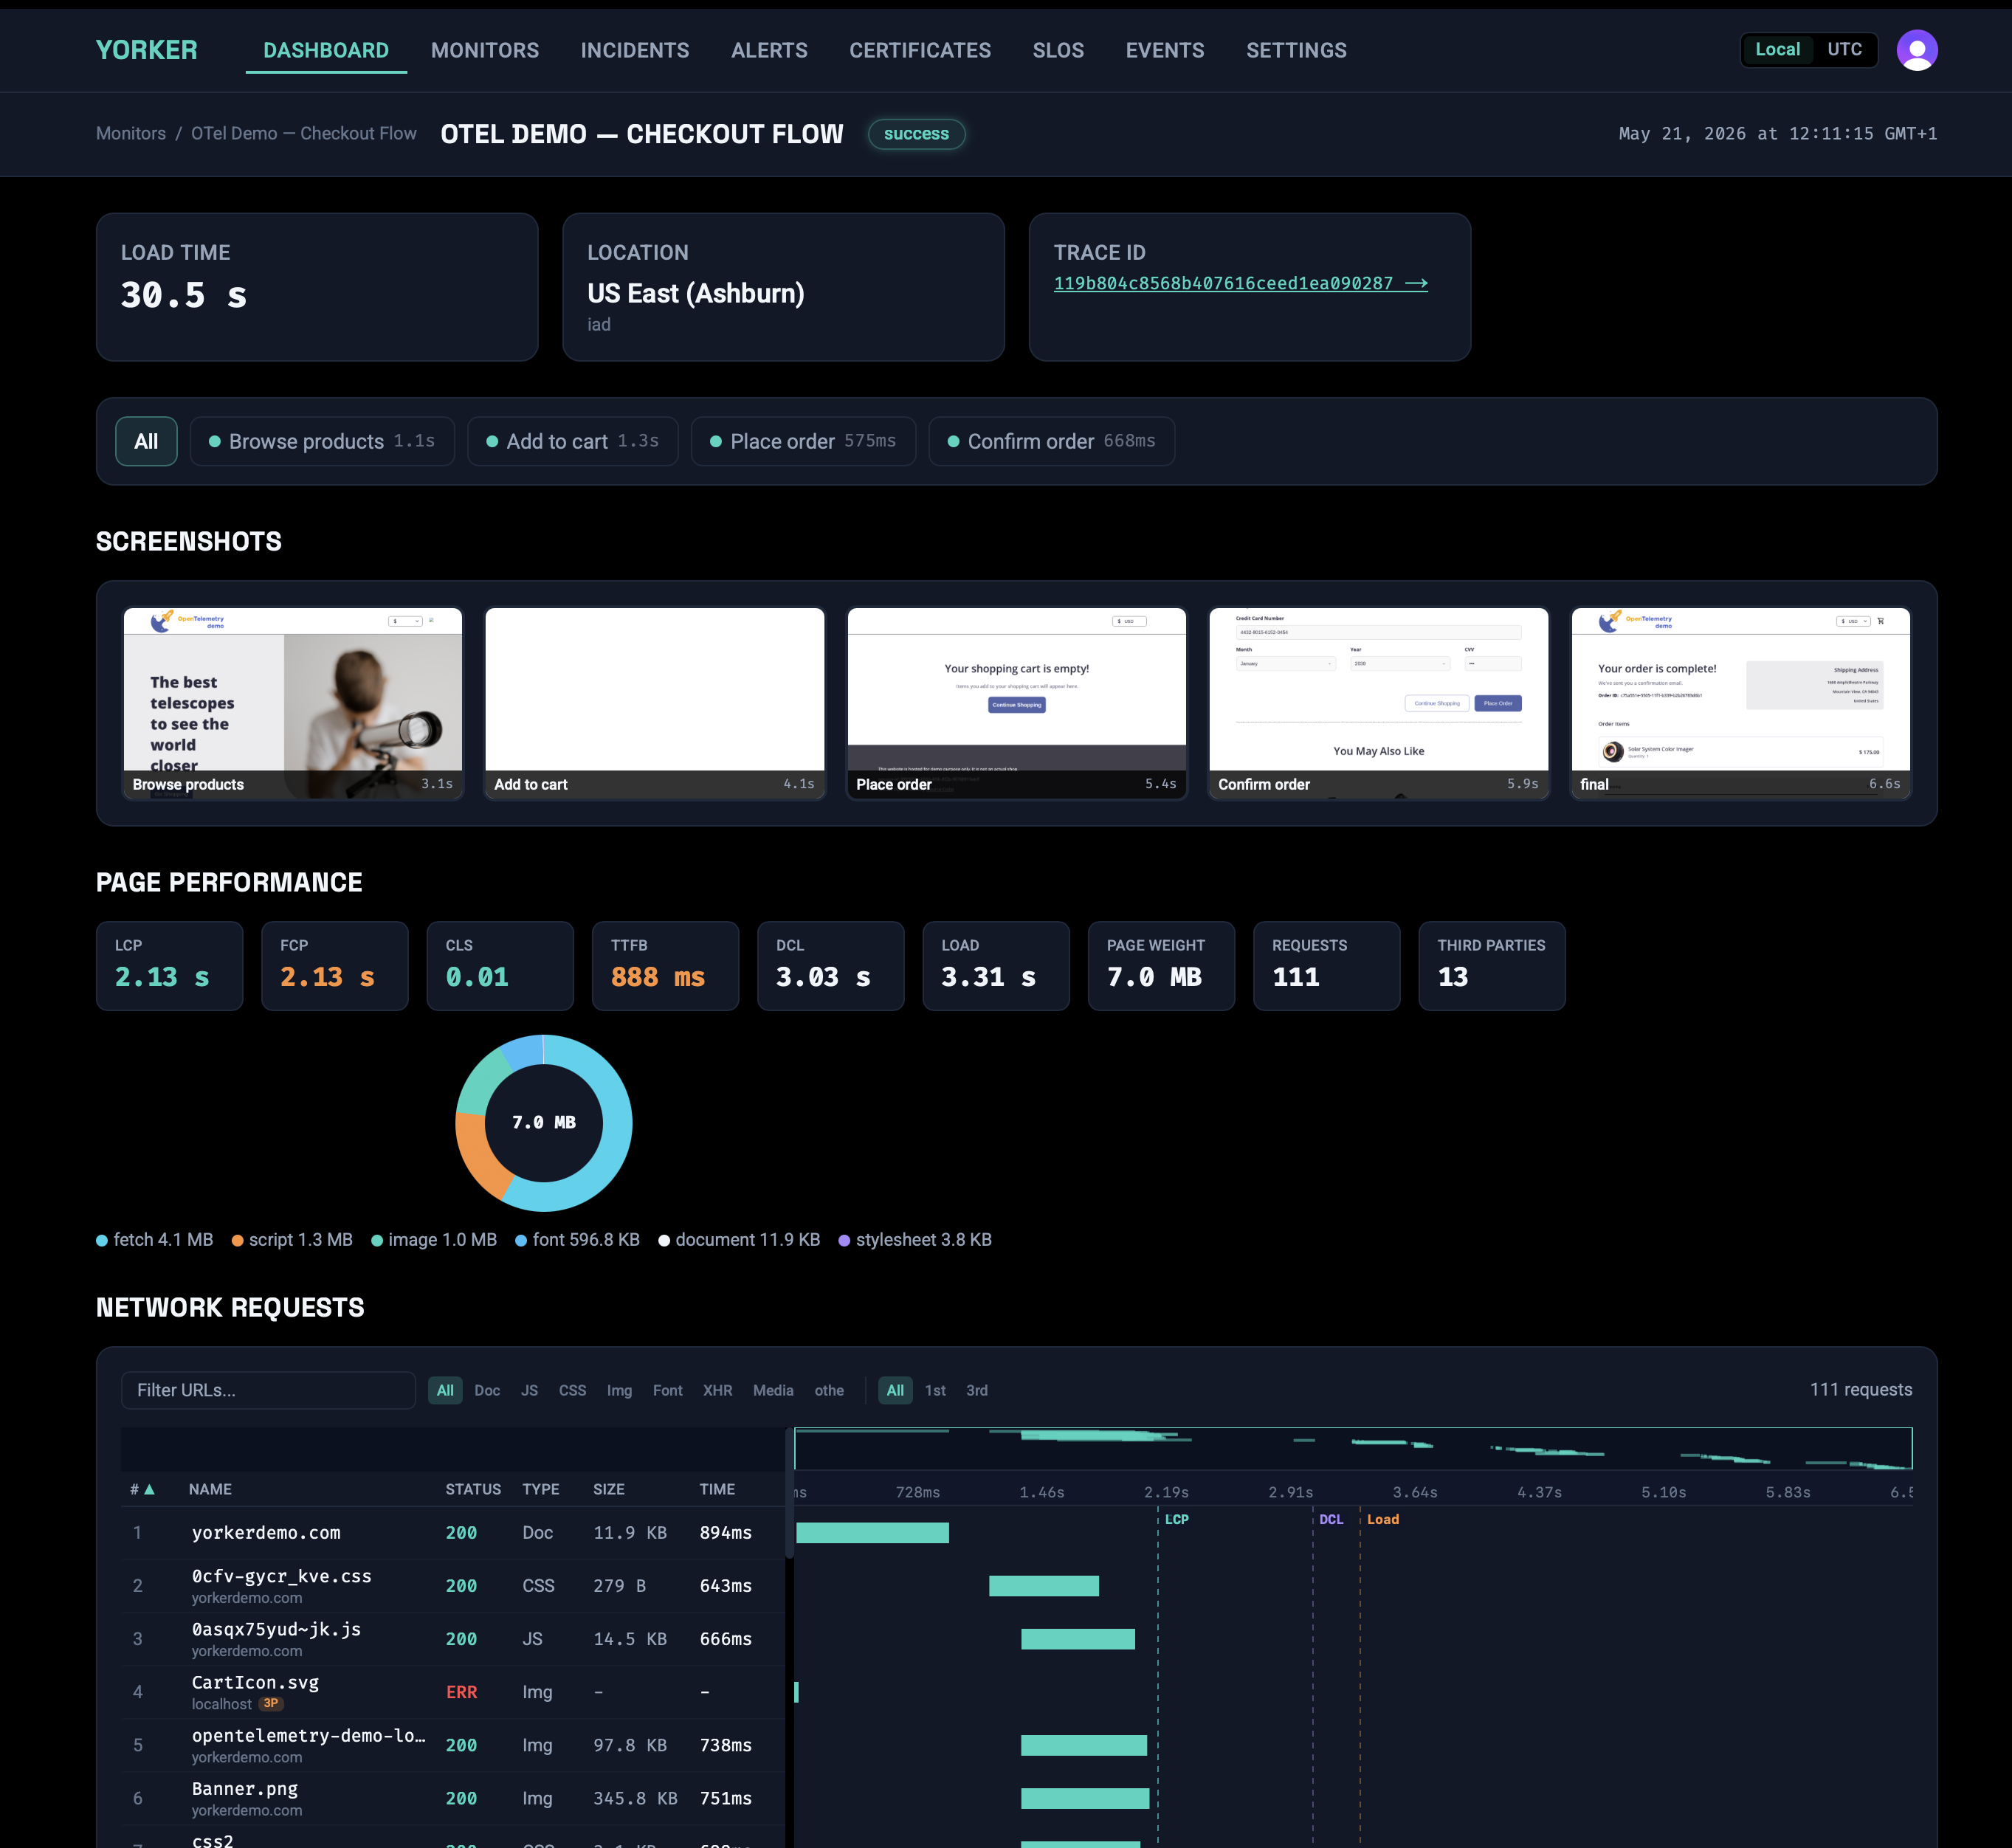
I build Yorker, so weigh that against everything above, but this problem is why we built the browser check the way we did. A Yorker browser check runs real Playwright in an isolated Chromium instance from any of 14 hosted regions, on a schedule, and captures LCP, FCP, CLS and TTFB automatically on every run using the same PerformanceObserver approach as the snippet above, with no extra script required. Each metric is anomaly-scored against a rolling 14-day baseline, computed separately per location and per hour of day, so a Tuesday-morning US-East run is compared against other Tuesday-morning US-East runs, not a global average a slow Frankfurt run at 3am would drag down.
Every browser check also classifies the page's network requests and flags the ones that hit a different hostname than the page itself. The dashboard breaks that weight down per third-party domain, and the check's OTel span carries the aggregate count, total bytes and the list of domains involved, so when a check drifts you can tell whether your own code or a tag manager's dependency got heavier this week. When a check fails or drifts, the filmstrip shows the frame-by-frame render rather than a single number, which matters more than you'd expect when the failure is "the layout jumped" and not "the request errored."
None of that replaces real-user monitoring. It catches the regression before your first real user does, tells you where on the page it happened and what got heavier, and keeps the budget somewhere a coding agent's next pull request can't quietly erode without a check turning red.