Synthetic checks as the deploy verification gate

A deploy used to end with someone tailing logs for ten minutes and glancing at a dashboard. That assumed a human triggered the deploy and a human would notice if it went wrong. Now deploys get kicked off by a merge queue, a bot auto-merging a dependency bump, or an agent shipping its own change, a shift I've written about before. Someone still has to answer "did that deploy work", but often nobody is watching when the question comes up, and whatever is asking wants something it can parse.
Synthetic checks fit that job. Post-deploy smoke tests are as old as deploys, so novelty isn't the argument. What matters is that they produce structured results from an unattended run against the thing that's live, which is what an automated gate consumes, as long as you set them up to be read by a script and not just watched. I build synthetic monitoring for a living, so weigh the argument with that in mind. It holds up without a product name, and I'll say where naming one becomes unavoidable.
What a deploy gate actually needs
Unit and integration tests run against the code before it ships. They tell you the change is internally correct. They don't tell you whether the deployed artifact works in the account currently serving traffic. A gate needs three things a test suite doesn't give you: it has to exercise the thing you just deployed, not a proxy for it; it has to be independent of the change, so a broken deploy can't also disable its own verification; and it has to answer in a shape a script can act on.
A real user journey hitting the live URL from outside the deploy's blast radius and returning a structured pass or fail is the job description of a synthetic check. Canary analysis on live traffic is the other obvious candidate, and it's powerful, but it needs traffic. A service that redeploys at 3am to near-zero load won't accumulate enough canary signal inside a reasonable verification window. A synthetic check generates its own traffic on demand.
Smoke gate, and the monitor that keeps running after it
Two things get conflated here. Post-deploy smoke is a check triggered on demand right after a deploy, evaluated against a fixed assertion, and expected to answer fast enough to block or unblock a pipeline. Continuous monitoring is the same check on its normal schedule, running regardless of what the gate decided and building a longer memory of what normal looks like.
You need both. A CI job waiting on a gate has a bounded budget: someone pays for that runner and the next deploy is queued behind it, so the gate can only catch regressions severe enough to trip a fixed threshold within a few minutes. Slower regressions, the ones that surface once real traffic exercises the new code path or an hour has passed, belong to the check running on its own schedule.
How many locations before you trust green
One green location doesn't prove the deploy is healthy everywhere, and one failing location out of several doesn't prove it's broken. Regional issues (a flaky resolver at one point of presence, a transient TCP reset) happen independently of what you just shipped, and a gate that rolls back on the first failing location will roll back for nothing more often than it catches a real regression.
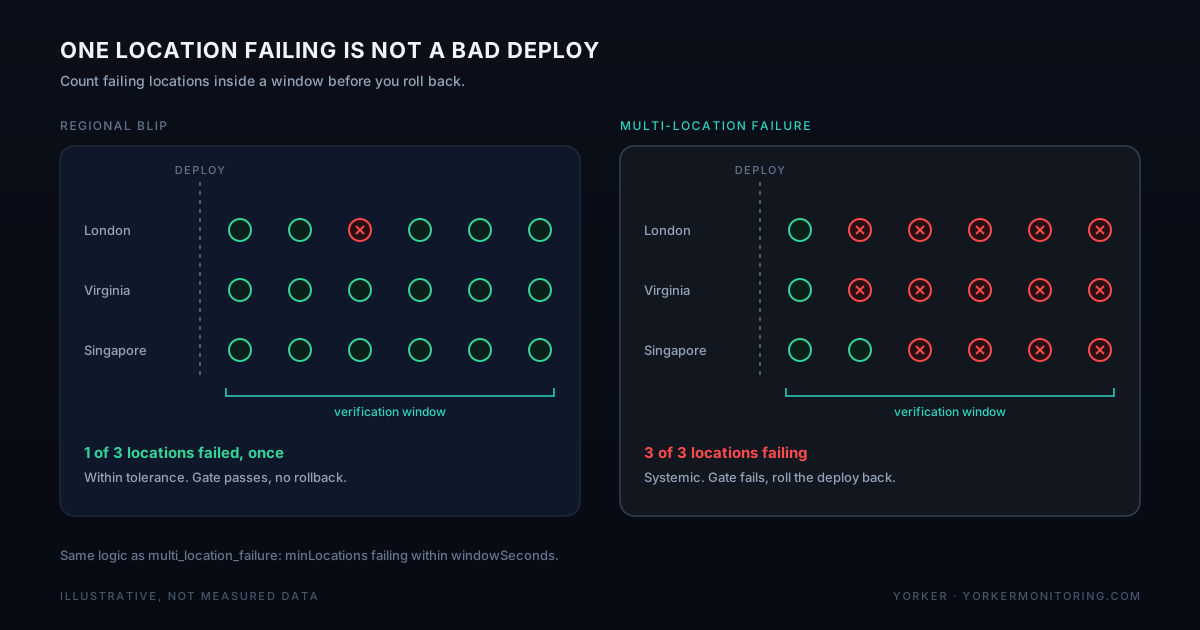
This is the problem Yorker's multi_location_failure alert condition exists to avoid for continuous alerting: it requires failures from minLocations within a windowSeconds, because a single-location failure and a systemic one look identical from inside that one location's result. A CI gate consuming ad hoc trigger results needs the same policy, and today it has to implement it itself: how many of the locations you triggered have to report failure, inside what window, before you call the deploy bad. There's no built-in default for a gate. Set the threshold too low and the gate is flaky; set it too high and it stops catching anything.
Baseline, not threshold
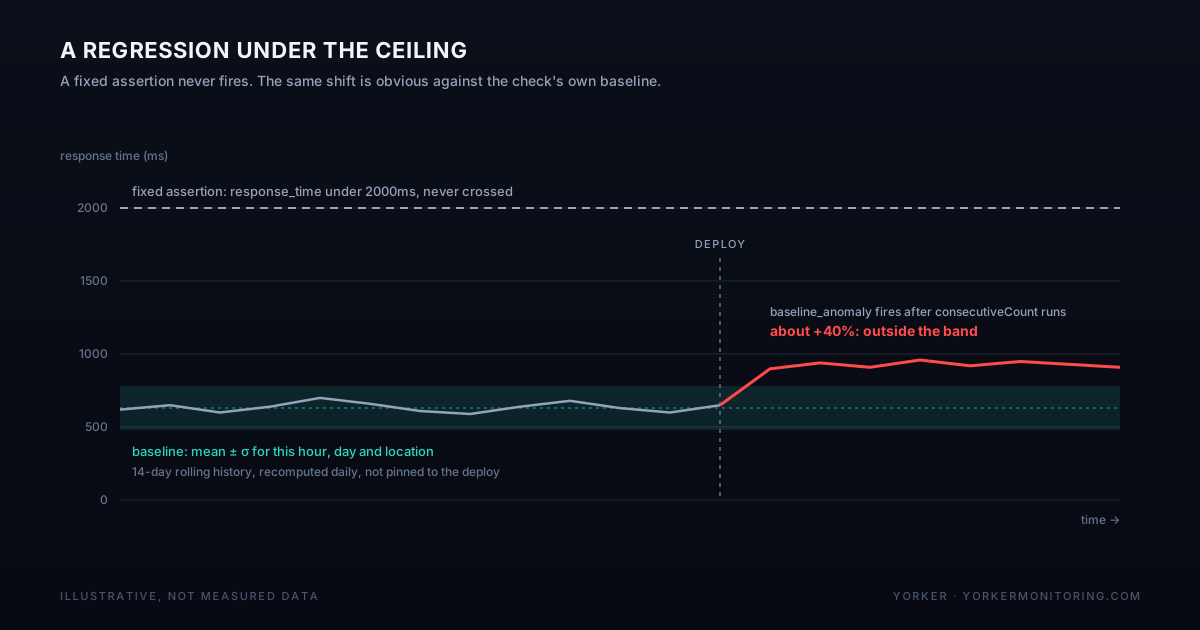
Fixed-threshold assertions (response_time under a max, status_code equals 200, body_contains a string) are fast, binary, and right for a go/no-go decision the moment after a deploy. They can't know what's normal. A response_time assertion set to 2000ms either tolerates a real 40% regression that lands under the ceiling, or flags a request that's slow for boring reasons (higher latency at 3am from a particular region) that have nothing to do with the deploy.
That's the case for scoring against a baseline instead of a fixed number. Yorker's baseline_anomaly alert condition does this continuously: it compares each of the last consecutiveCount successful runs against a 14-day rolling baseline bucketed by hour-of-day, day-of-week, and location, and fires when the deviation crosses a sigma threshold in the configured direction. "Slow" gets judged against what that check normally does on that day, at that hour, from that location, not a number someone picked once and forgot to revisit.
Two details matter if you're building a gate around this:
- That baseline isn't a snapshot frozen at deploy time. It's the check's rolling history. It catches a deploy regression because a regression is abnormal for its slot, and Yorker does not take a "before" reading the moment you push. If you want a baseline pinned to "the state before this deploy," that's a fixed threshold you choose deliberately, not what
baseline_anomalygives you. - The anomaly score is an OTLP log-event attribute on
synthetics.check.completed, delivered to your own OTel backend once you've configured one. It is not present in theGET /api/checks/:id/resultsresponse a CI gate would be polling; that endpoint returnsstatus,responseTimeMs,httpStatusCode, and atimingbreakdown, not a sigma deviation. If you want the gate itself to reason about baseline deviation rather than a fixed assertion, today that query has to go against your OTel backend from inside the pipeline, not the REST API. Check this before you design a gate around a field that isn't there.
Tying the failure back to the version that shipped
A gate that reports "checkout flow failed" is useful. A gate that reports "checkout flow failed, and the failing request shares a trace ID with three 503s in payments-api v2.18.0" hands someone a diagnosis before they've opened a laptop. Every HTTP, browser, and MCP check Yorker runs injects a W3C traceparent header into its requests; if your backend continues that context, which most OTel-instrumented services do by default, the synthetic run and the spans it triggers land in one trace. Record the deploy alongside it (POST /api/events/deployments takes service, version, and commit_sha, turns it into a synthetics.deployment.created event, and writes a row the dashboard lines up against check-result anomaly windows) and a failing gate check points at a trace, and the trace points at a version.
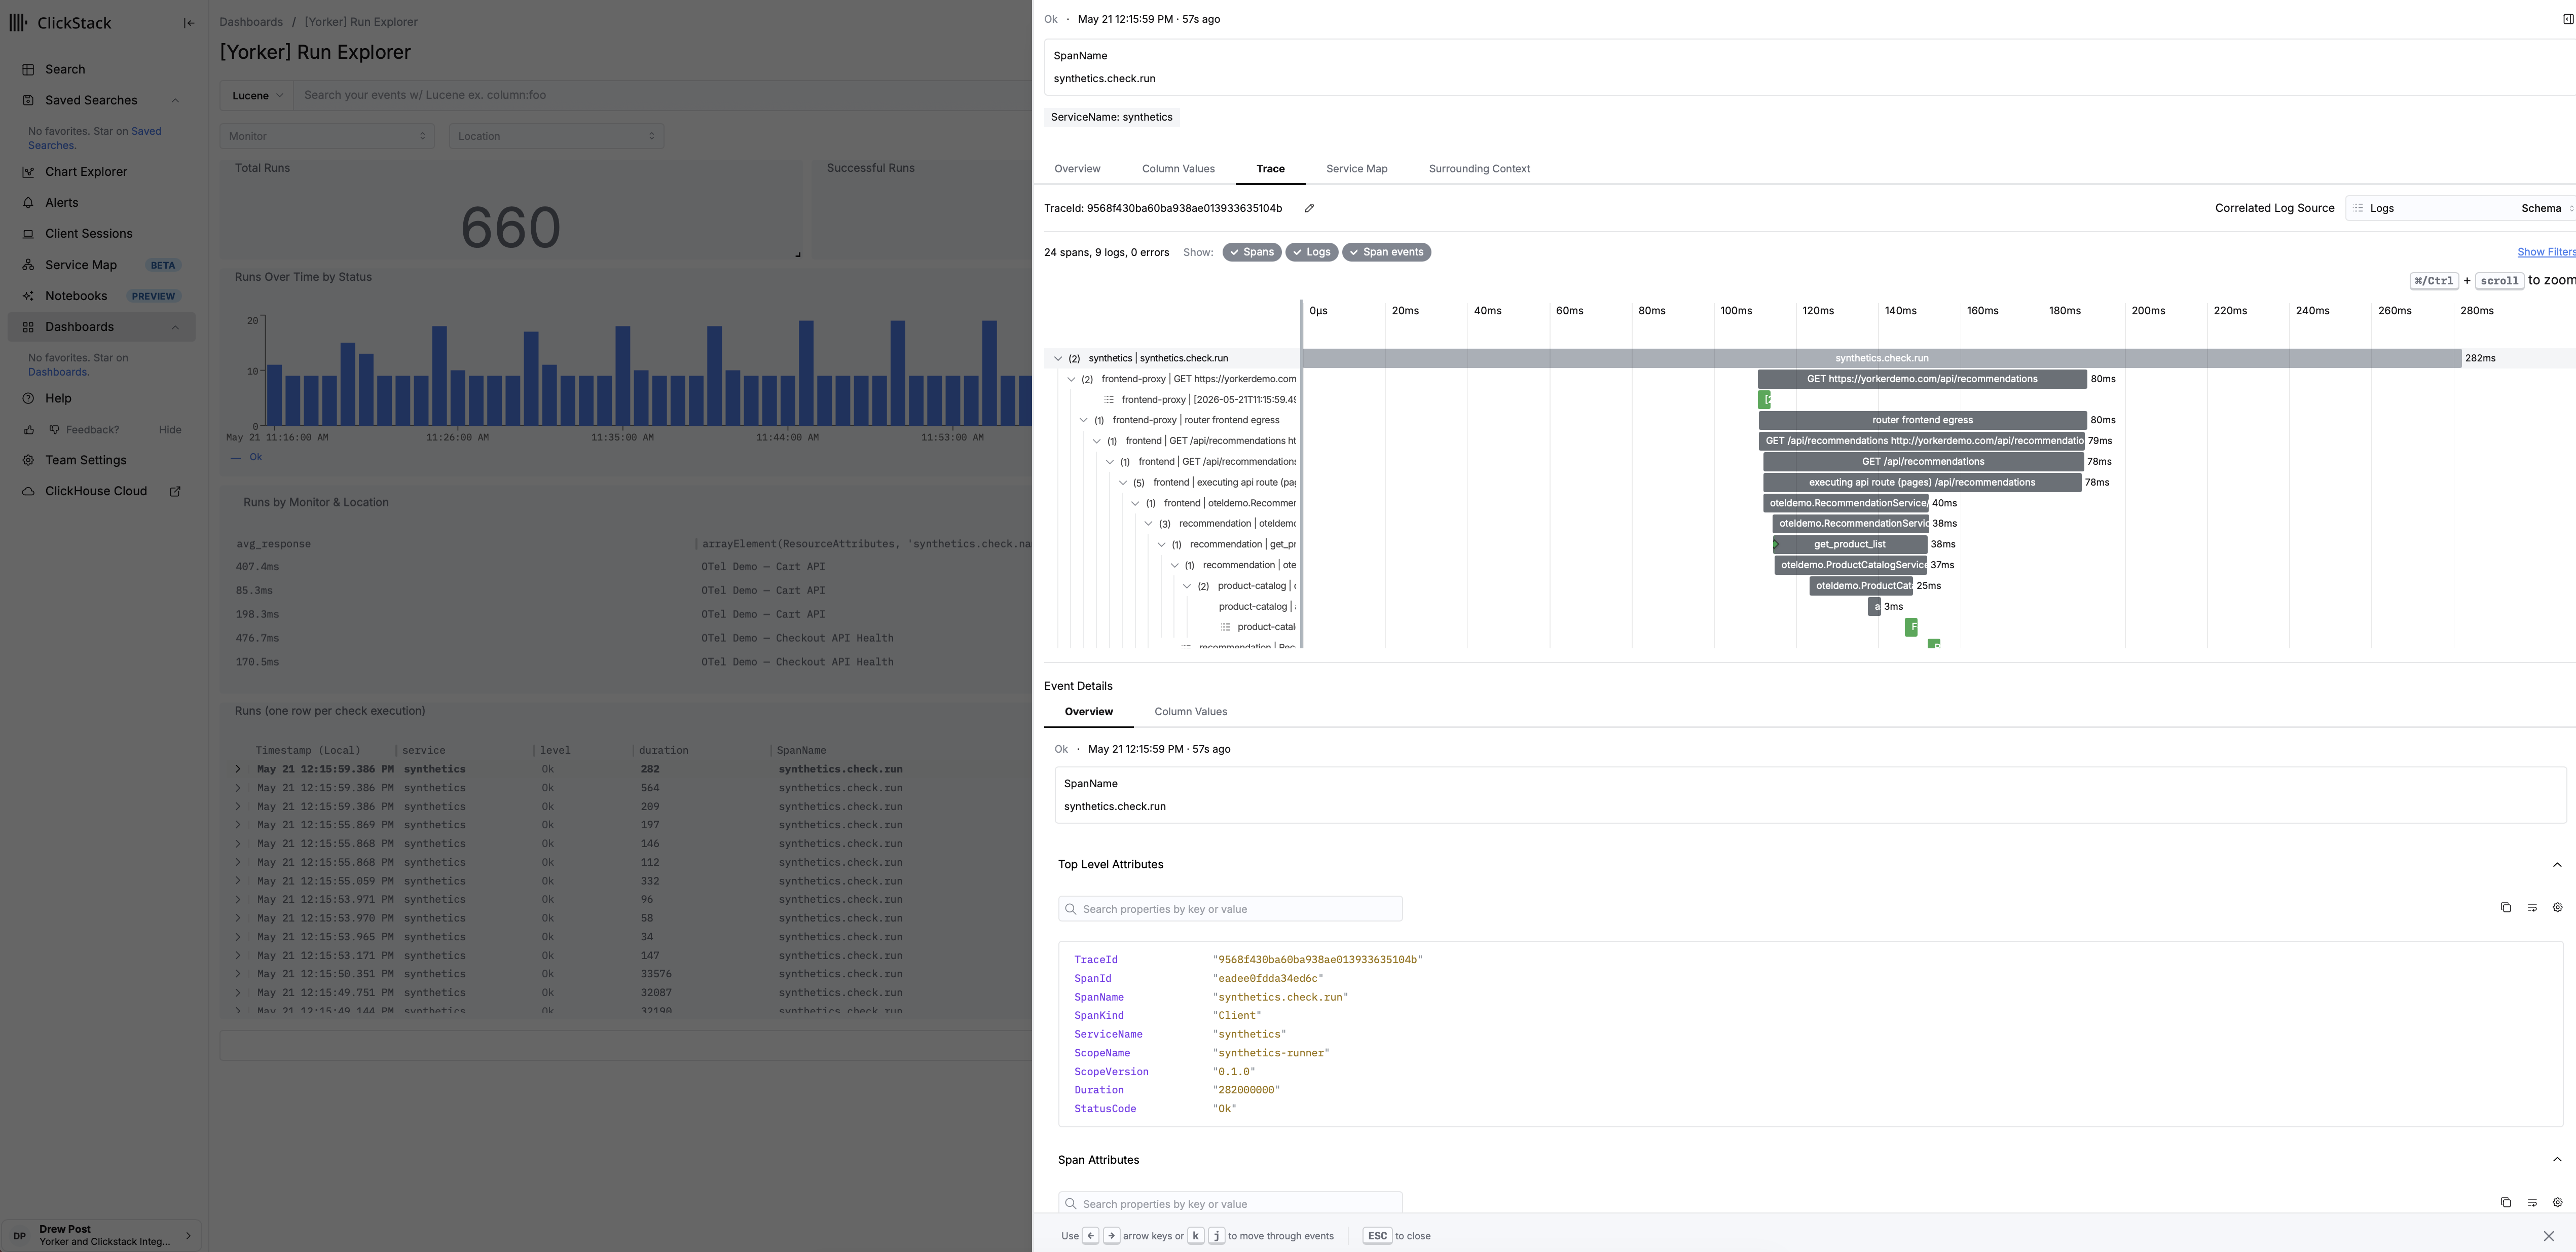
This is the same argument I made in the missing input to your AI-SRE tool, applied to a deploy gate instead of an incident. A status dot and a pile of screenshots suit a person triaging at their own pace. A trace ID, a check ID, and a structured status field suit whatever consumes the gate's decision, whether that's an if block in a workflow file or an agent deciding whether to roll back its own change.
Wiring it into CI
There's no single command that does this end to end yet. What exists is POST /api/checks/:id/trigger, which forces an immediate run across a check's assigned locations, and GET /api/checks/:id/results, which reads results back, both documented in the REST API reference. The gate itself (the polling loop and the pass/fail policy) is something you write.
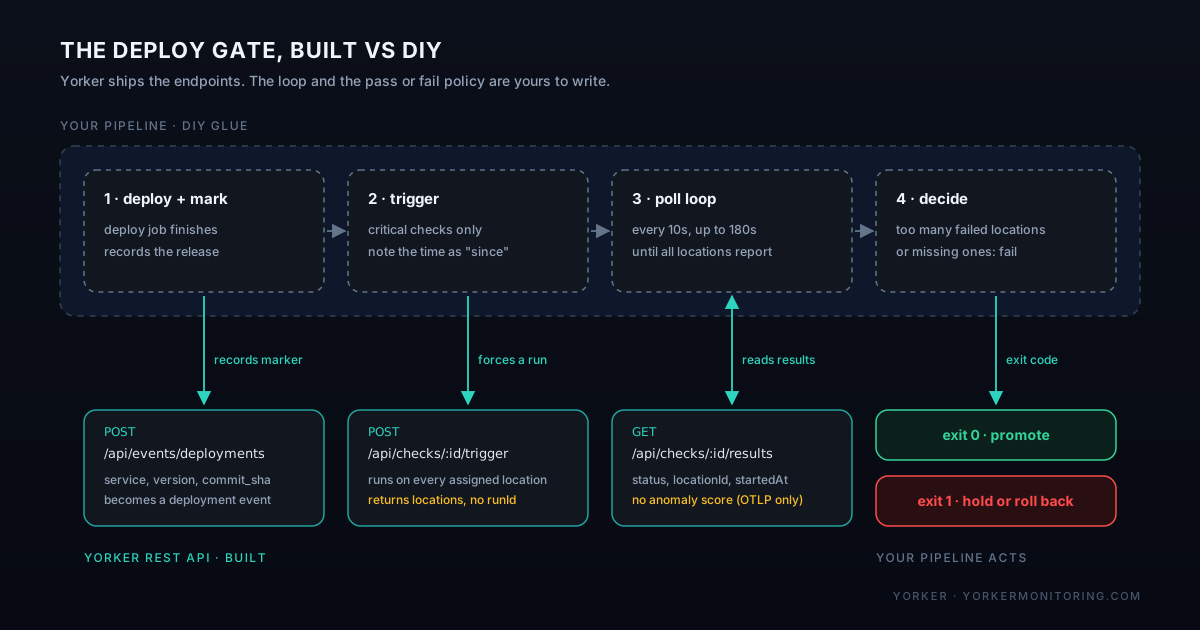
Here's a version of it as a step after a deploy job:
#!/usr/bin/env bash
set -euo pipefail

API="https://yorkermonitoring.com"
AUTH="Authorization: Bearer ${YORKER_API_KEY}"

# Check IDs for the journeys that matter enough to block a deploy on.
CRITICAL_CHECKS=("chk_checkout_flow" "chk_login" "chk_orders_api")

MAX_FAILED_LOCATIONS=1   # tolerate one regional blip, not more
POLL_TIMEOUT_S=180
POLL_INTERVAL_S=10

# Record the deploy so it's on the record for later correlation,
# independent of the pass/fail decision below.
curl -sf -X POST "$API/api/events/deployments" \
  -H "$AUTH" -H "Content-Type: application/json" \
  -d "{\"service\":\"checkout-api\",\"version\":\"${GITHUB_SHA}\",
       \"environment\":\"production\",\"commit_sha\":\"${GITHUB_SHA}\",
       \"source\":\"github-actions\"}" > /dev/null

overall_exit=0

for check_id in "${CRITICAL_CHECKS[@]}"; do
  triggered_at=$(date -u +"%Y-%m-%dT%H:%M:%S.000Z")

  expected_locations=$(curl -sf -X POST "$API/api/checks/${check_id}/trigger" \
    -H "$AUTH" | jq -r '.locations')

  elapsed=0
  seen_locations=0
  failed_locations=0

  while [ "$elapsed" -lt "$POLL_TIMEOUT_S" ]; do
    sleep "$POLL_INTERVAL_S"
    elapsed=$((elapsed + POLL_INTERVAL_S))

    results=$(curl -sf "$API/api/checks/${check_id}/results?limit=20" \
      -H "$AUTH" | jq --arg since "$triggered_at" \
      '[.results[] | select(.startedAt >= $since)]')

    seen_locations=$(echo "$results" | jq '[.[].locationId] | unique | length')
    failed_locations=$(echo "$results" | \
      jq '[.[] | select(.status != "success")] | length')

    [ "$seen_locations" -ge "$expected_locations" ] && break
  done

  if [ "$seen_locations" -lt "$expected_locations" ]; then
    echo "::error::${check_id} only reported from ${seen_locations}/${expected_locations} locations in ${POLL_TIMEOUT_S}s"
    overall_exit=1
  elif [ "$failed_locations" -gt "$MAX_FAILED_LOCATIONS" ]; then
    echo "::error::${check_id} failed from ${failed_locations}/${expected_locations} locations"
    overall_exit=1
  fi
done

exit $overall_exitA few choices in that script are deliberate. expected_locations comes straight off the trigger response's locations field, so the loop knows how many distinct locationId values to wait for instead of guessing. The failure policy is "more than MAX_FAILED_LOCATIONS failed" rather than "any failure fails the build", for the same reason multi_location_failure exists. And there's a real gap to know about: the trigger response doesn't return a runId, so the loop filters results by startedAt after the trigger call rather than by run. That's fine for one trigger per check per deploy; if you're triggering the same check back to back inside a pipeline, you'll need to track more carefully than this does.
If you'd rather not hand-roll the curl and jq, the same JSON envelope and exit-code conventions already back yorker validate, diff, and deploy for config changes, documented in CI/CD Integration. There's no equivalent command for the deploy-verification loop above: the REST API is built, and the gate on top of it is DIY. A first-class command to close that gap is on the list. It hasn't shipped.
One adjacent point: config that lives with the code it's gating tends to get maintained. I made that case in shipping the monitor with the pull request, and it applies directly here. If nobody remembers configuring the check IDs a gate script references, nobody will trust it when it finally fires.