When your user is an agent

Every synthetic check encodes an assumption about who is on the other end. An uptime ping assumes a person waiting for a page to load. A scripted browser transaction assumes a person clicking log in, then add to cart, then pay, at human speed, in a real browser rendering real pixels. Even the industry's language gives it away: we call it a "user journey," and the user we mean, without ever quite saying so, is a person.
That assumption held for thirty years because it was true. The traffic that mattered came from people with browsers, so a tool that simulated one of those people well could tell you whether your product worked.
That's no longer the whole picture. I've written before about how the category kept answering last decade's question while the ground moved underneath it. This post is about one specific shift: the persona itself.
A growing share of your traffic isn't human
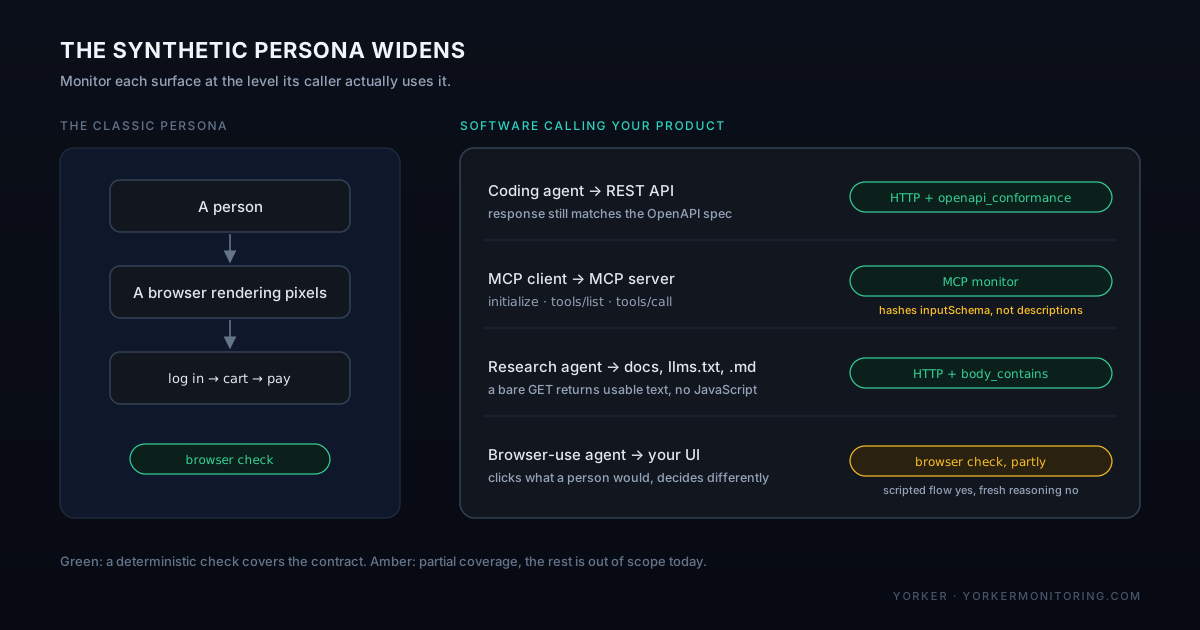
A coding agent in a CI pipeline calls your endpoints to run an integration test it wrote itself. A support assistant calls an MCP server you stood up so it can look up an order without an engineer wiring a bespoke integration. A research agent fetches your docs to work out how your product behaves before it ever asks a person a clarifying question. In some products a browser-use agent is now driving the UI directly on a person's behalf, clicking the same buttons a human would click, except nothing about how it decides what to click is human.
These callers aren't edge cases. They're becoming a normal, load-bearing part of how a product gets used, the same shift from the other direction I've written about with coding agents. A synthetic monitor built entirely around the human persona says nothing about whether any of it works.
Where "it works" and "it works for an agent" diverge
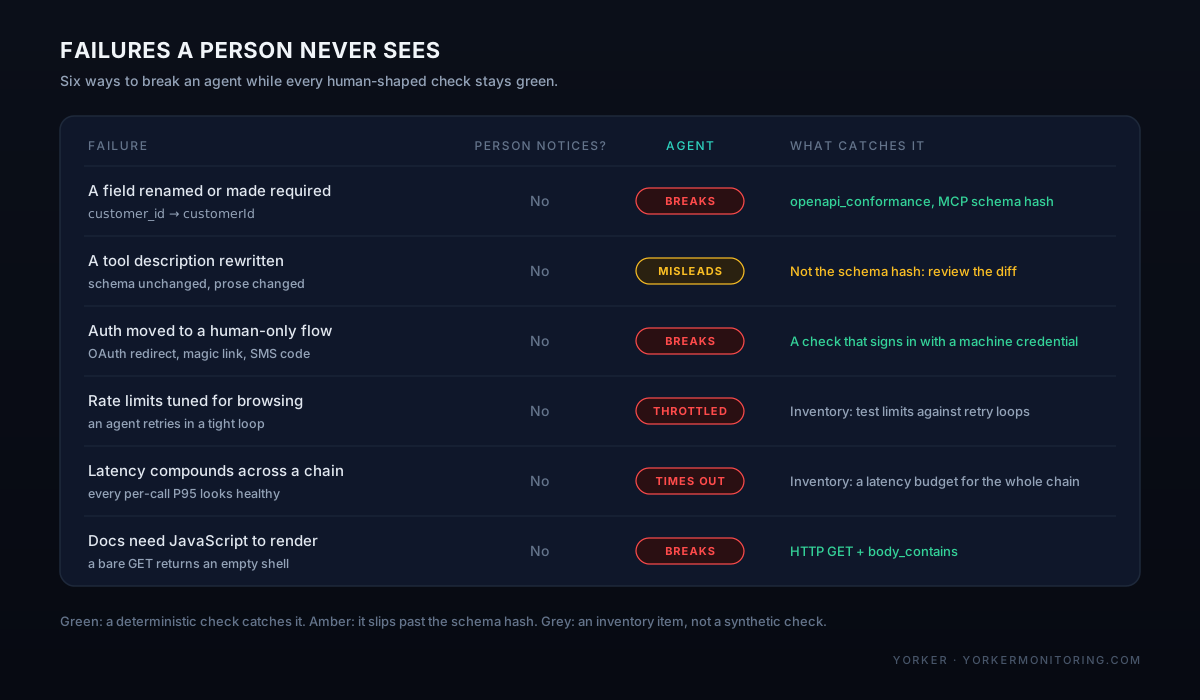
Agents fail differently from people, and the differences don't show up in a human-shaped check.
A schema change invisible to a person breaks tool calling
Rename a JSON field from customer_id to customerId, or make a previously optional parameter required, and a person skimming a rendered page never notices. An agent parsing the response by exact key either throws or, worse, silently drops the field and improvises a plausible replacement. Your uptime check still reports 200.
A rewritten tool description misleads the model
In MCP, the natural-language description attached to a tool is part of the contract. It's the text the model reads to decide which tool to call and what arguments to pass. Rewrite that description and the model's behaviour can shift while the schema underneath stays put. That's a real gap even in dedicated MCP monitoring: schema-drift detection that hashes a tool's inputSchema won't catch a description-only edit, because the hash is over the schema, not the prose. Whatever your monitoring catches, treat a tool description edit as a reviewed API change.
Auth built for a person doesn't work for a machine
An interactive OAuth redirect, a magic link, an SMS code: all of them assume a browser and a human working through a consent screen. An agent running on a schedule, or granted a service credential by another system, needs a client-credentials flow or a long-lived key. A sign-in-with-Google button is no use to it. Migrate your auth without keeping a machine path and you break every agent integration silently, because nobody's staring at a login page to notice.
Rate limits tuned for browsing don't survive agent loops
A person reloads a page every few seconds at most. An agent that gets a failed tool call can retry with adjusted arguments in a tight loop as part of finishing one task. Limits set for human traffic either throttle a legitimate agent into failure or get raised so far they stop protecting anything.
Latency compounds across a chain
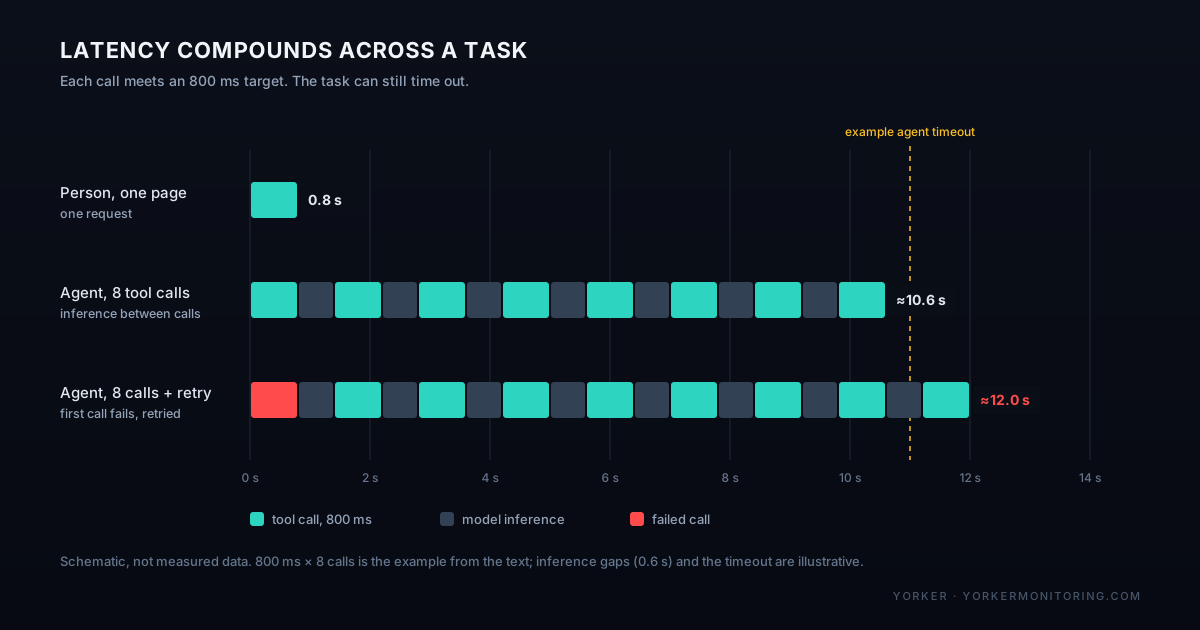
A single endpoint's P95 hides this. An 800ms response is fine for a person waiting on one page load. An agent that chains eight tool calls to finish one task pays that 800ms eight times, plus model inference between each step. A perfectly healthy per-endpoint SLO can sit underneath a task that times out from the agent's side, and nothing in the individual check tells you that.
Docs that render for a person can be invisible to a fetch
A documentation site that needs JavaScript to paint any body text, or hides the answer behind a client-side search widget, works fine for a person with a browser tab open. An agent issuing a plain HTTP GET against that same URL can get back an empty shell and nothing else, and it either hallucinates an answer or gives up.
None of these shows up as a failed HTTP check, yet each one is a broken product for a user that happens to be software.
Widen the persona
Bolting a new check type onto the old ones doesn't fix this. The synthetic persona has to widen from "a person with a browser" to "whatever kind of client actually depends on this surface," and each surface gets monitored at the level its caller operates at.
For a human, that level is a rendered page. For an agent calling an API, it's the contract: does the response still match the shape the client was built against? For an agent talking to an MCP server, it's the protocol session: did the handshake complete, is the tool the agent needs still in the catalog, has its schema moved since the last time anything checked. For an agent reading your docs, it's whatever a bare fetch actually returns.
I build Yorker, so weigh what follows accordingly. The argument doesn't need the product, though. If a meaningful share of the traffic that matters to you is software, the surfaces it depends on belong in the same SLOs as your human-facing ones, checked at the protocol level those callers use rather than pinged for a status code.
A monitor that speaks the same protocol your agents do
In practice that means checking API contracts and MCP sessions the way a real client exercises them. In yorker.config.yaml, that's an HTTP monitor with an openapi_conformance assertion next to an MCP monitor:
# yorker.config.yaml
project: my-api

monitors:
  - name: "Orders API (agent-facing)"
    type: http
    url: https://api.example.com/v1/orders
    frequency: 1m
    locations:
      - loc_us_east
      - loc_eu_central
    assertions:
      - type: status_code
        value: 200
      - type: openapi_conformance
        specId: spec_orders_v1
        validateHeaders: true

  - name: "Support MCP server"
    type: mcp
    endpoint: https://mcp.example.com/mcp
    frequency: 5m
    locations:
      - loc_us_east
      - loc_eu_west
    timeoutMs: 30000
    auth:
      type: bearer
      token: "{{secrets.MCP_PROBE_TOKEN}}"
    expectedTools:
      - get_order_status
      - create_return
    testCalls:
      - toolName: get_order_status
        arguments:
          order_id: "test-probe-001"
        expectedOutputContains: "probe"
detectSchemaDrift: trueThe HTTP monitor checks more than the 200. openapi_conformance validates the live response's status code and body shape against a spec you've registered in Yorker, so a field rename or a newly required parameter fails the check on the run it ships, not the week an agent starts sending malformed requests because of it.
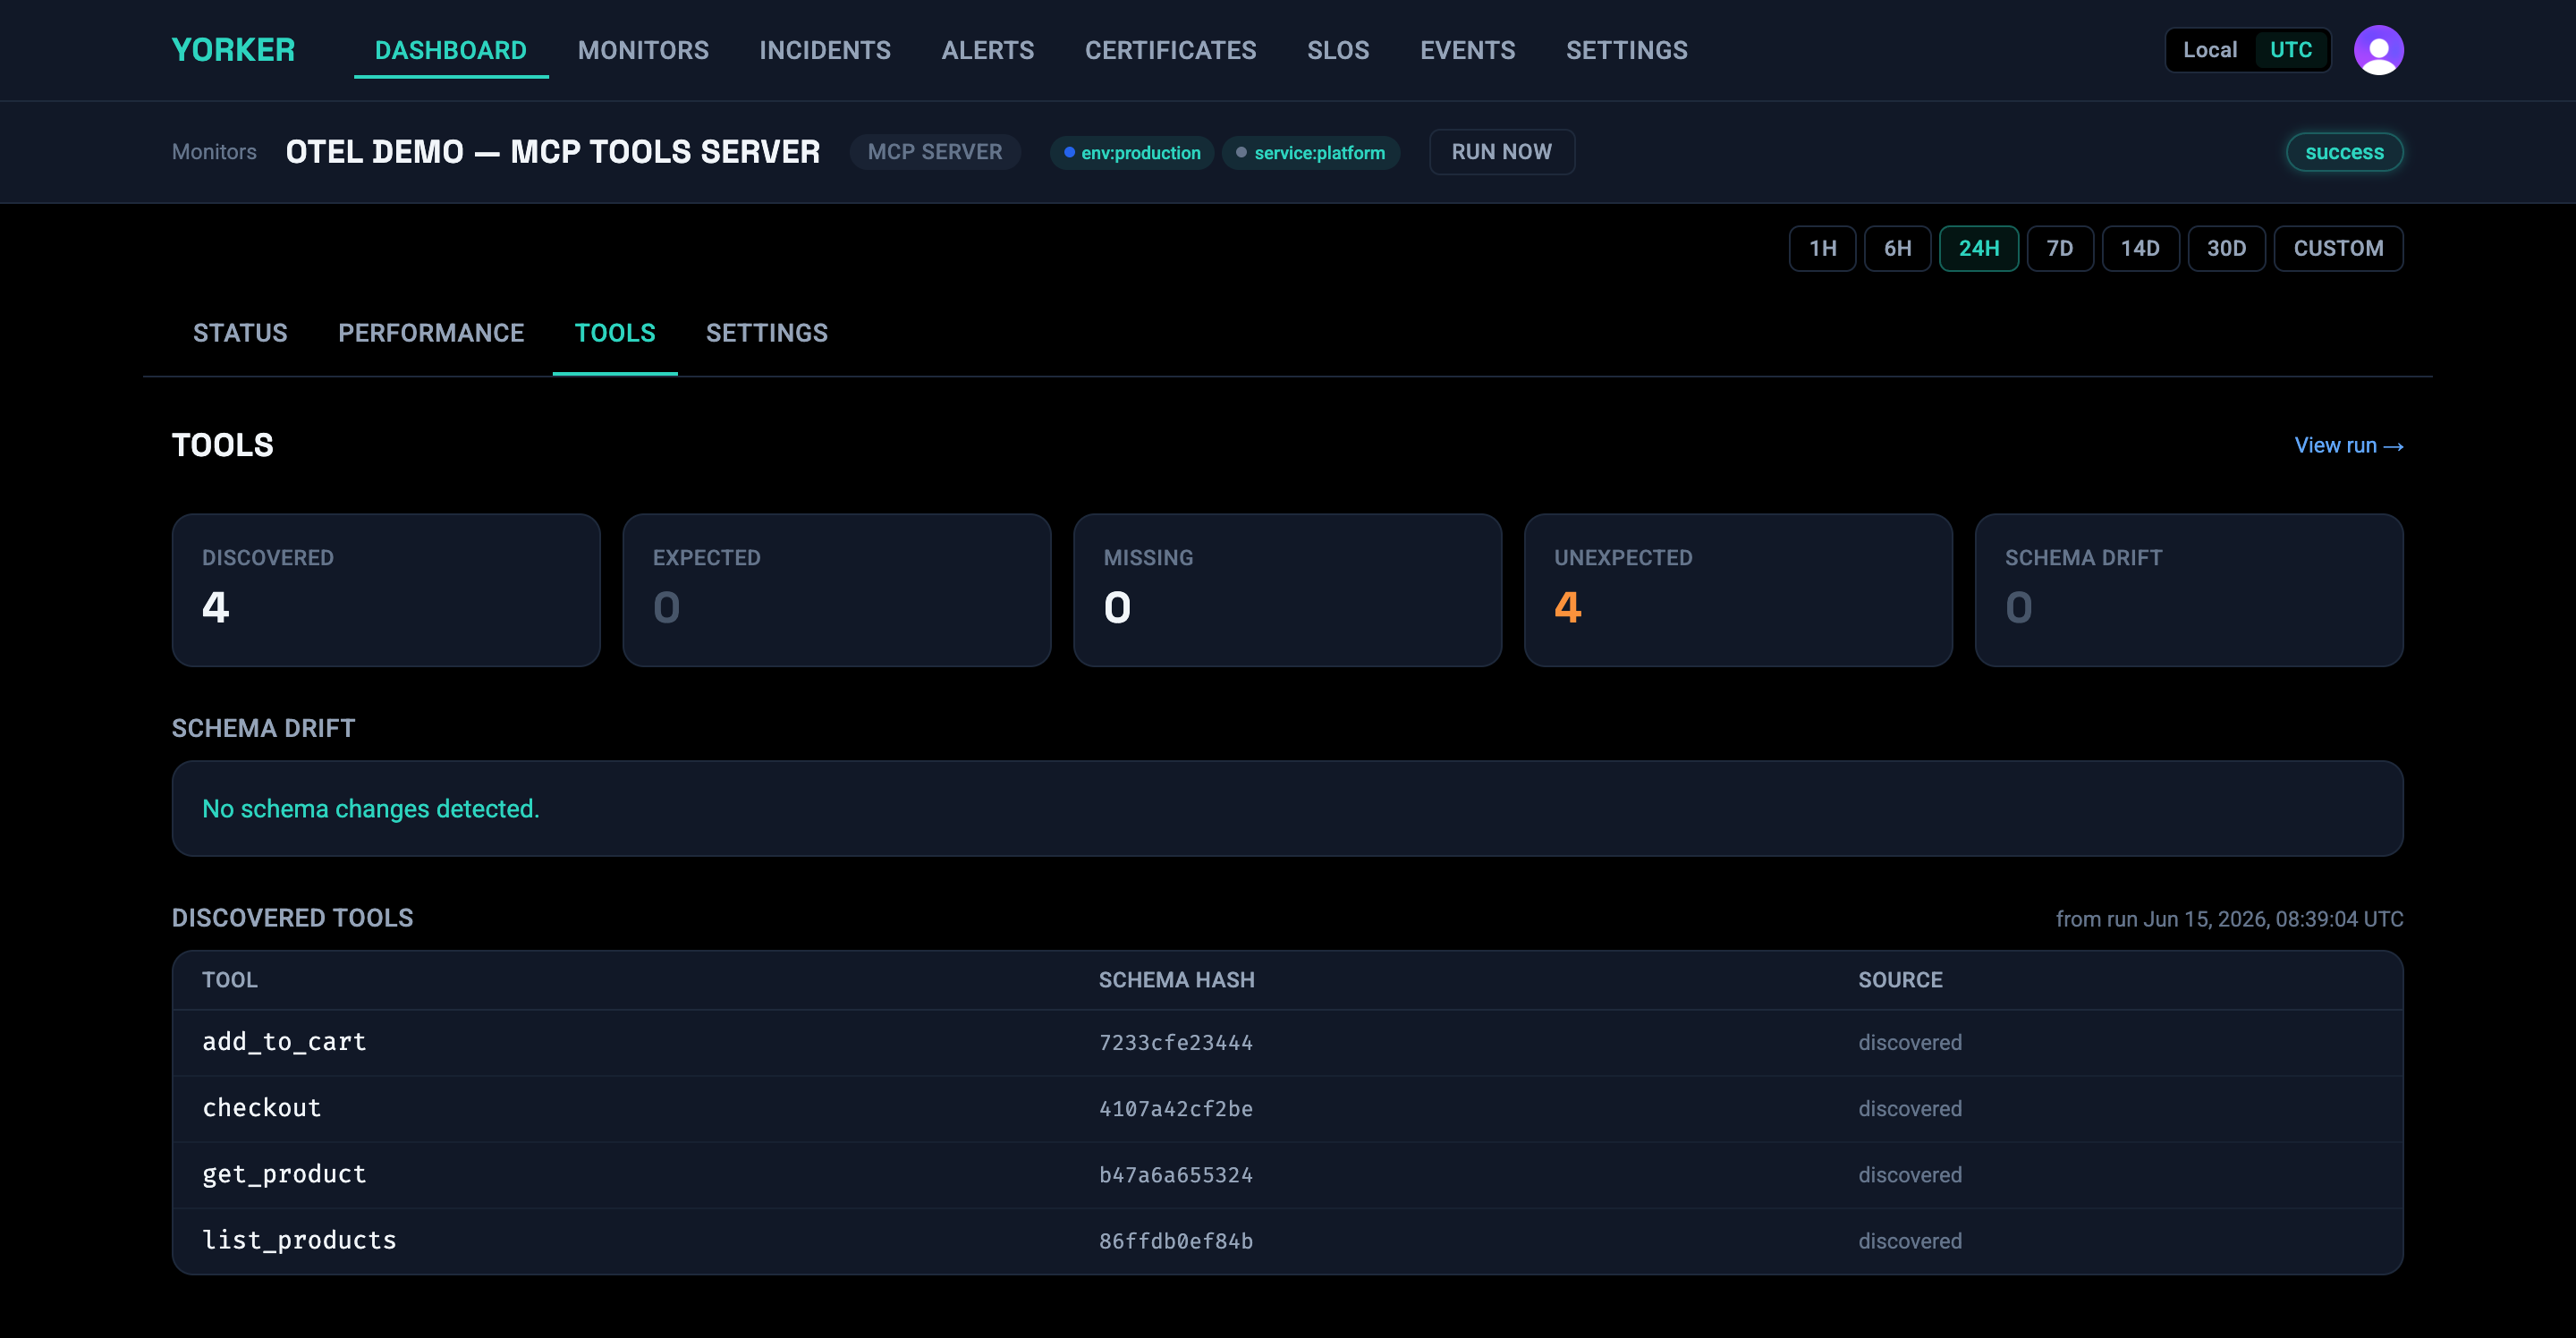
The MCP monitor runs the actual session: initialize, notifications/initialized, tools/list, then the testCalls you've defined, and it hashes every tool's input schema to catch drift between runs. I've written the full mechanics of how that works separately, so I won't repeat it here.
What this doesn't do
Both of those checks are deterministic. They run the same JSON-RPC session or the same HTTP request every cycle and assert against a spec or an expected shape you defined. Neither one runs an LLM to decide what to do next, and the argument above shouldn't be read as implying otherwise.
An MCP monitor won't catch a tool description edit that leaves the schema untouched, for the reason above: drift detection hashes inputSchema, not description. If your tool descriptions change, review that diff the way you'd review any other API contract change. A browser check, similarly, runs a Playwright script, hand-written or generated from a plain-language description, that exercises specific steps in a specific order. It tells you whether the flow it was built against still works. It won't tell you whether a browser-use agent, reasoning fresh about a redesigned page, could still work out where to click. Those are different questions, and only one of them has a good deterministic answer today.
We hold ourselves to the docs-for-a-fetch standard too. Every page on the Yorker site, including this one, has a plain Markdown twin at the same URL with .md appended, and /llms.txt indexes the lot, so an agent doing a GET against our docs gets the same content a person gets from the rendered page.
Your agent-facing surface: an inventory
Whatever you monitor it with, start by knowing what you have:
- Every MCP server you run in production: endpoint, auth type, tool count, and whether anything is watching for schema drift.
- Every API a coding agent, workflow tool, or third-party integration calls without a human in the loop, and whether that path is checked against a contract or just a status code.
- Whether auth on those paths is machine-shaped (API key, service account, client credentials) or quietly assumes an interactive browser session.
- Your rate limits, checked against agent retry behaviour rather than human browsing patterns. A tight retry loop from one client doesn't look like a person refreshing a page.
- Whether your published docs, and any
llms.txtyou've shipped, return usable text to a bare fetch, not only to a browser with JavaScript enabled. - A rough latency budget for the whole chain an agent runs rather than the slowest single call inside it, if you can estimate how many calls a typical task makes.
- Which of the above already sits inside an SLO next to your human-facing app, and which one currently has nobody watching it at all.
That last one is usually the honest answer to "are we monitoring our agent-facing surface": mostly not, because nobody built the persona for it yet.